 Microsoft Azure
 Cloud Financial Management (FinOps)
 How to Operationalize FinOps
What Is AWS Cost and Usage Report (CUR)?
The AWS Cost and Usage Report (CUR) tracks AWS costs and usage at the account or organization level by usage type, operation, and product code. It lets you use Cost Categories and Cost Allocation tags to fine-tune the information.
The AWS Cost and Usage Report offers a comprehensive set of cost and usage data across AWS. It includes metadata about AWS services, credit, pricing, fees, discounts, taxes, cost categories, Savings Plans, and Reserved Instances.
You can view the Cost and Usage Report at monthly, daily, or hourly levels of granularity. Using the AWS Cost and Usage Report for both member and management accounts enables management accounts to share reports with member accounts instead of repeatedly creating reports for members.
In this article, you will learn:
- How the AWS Cost and Usage Report Works
- AWS CUR: Pros and Cons
- Tutorial: Creating Cost and Usage Reports
- Automatically Optimizing AWS Costs with Spot
How the AWS Cost and Usage Report Works
The AWS Cost and Usage Report accumulates data over a given month and includes all current billing data for that month when you generate a report. However, each report is an estimation subject to changes according to actual usage.
Each AWS service provides usage-based billing information during different times, so updates in your report may occur during different times. AWS finalizes usage charges at the end of the month when issuing an invoice with usage charges.
Updates and refunds
AWS may update your report and apply refunds, support fees, and credits to the monthly usage. You can learn whether your bill was finalized by checking if the InvoiceId column (you can find it in the Cost and Usage Report) includes an Invoice ID for a line item. If it does, those line items are final.
AWS calculates developer, business, and enterprise support according to final usage charges, reflected on the 6th or 7th day of each month for the previous month’s report. AWS applies refunds and credits according to your contract or agreement with AWS.
Related content: Read our guide to AWS cost optimization
AWS CUR: Pros and Cons
Here are some of the key advantages of using AWS Cost and Usage Report:
- Provides details about spending on AWS—shows granular details about spending on specific Amazon resources, trends in usage and costs, and provides a better understanding of the details behind buckets of IT expenditure.
- Provides details about usage—offers usage details in very fine detail, from the types of resources used on AWS to their utilization, data transfer rates, etc. This makes it possible to understand if resources are used to their maximum potential and whether there is room for optimization.
- Easy access to granular data—when using Amazon Cost Explorer, it is difficult to gain access to the detailed, raw data provided by CUR. By using CUR, finance teams and managers can gain access to detailed information that would otherwise be inaccessible to them.
There are also disadvantages to using CUR:
- Data is complex and difficult to interpret—the report provides such detailed, specific data that can be difficult to use and understand. It is highly recommended to get assistance from an individual who has experience with these reports who can help you derive the relevant insights.
- The only way to directly receive cost and usage data—Amazon currently does not offer other options for retrieving granular data about usage of its services.
You can complement CUR with the AWS Cost Calculator to get additional insights into your Amazon costs.
Tutorial: Creating Cost and Usage Reports
Here is how to create a Cost and Usage Report with the Billing and Cost Management console:
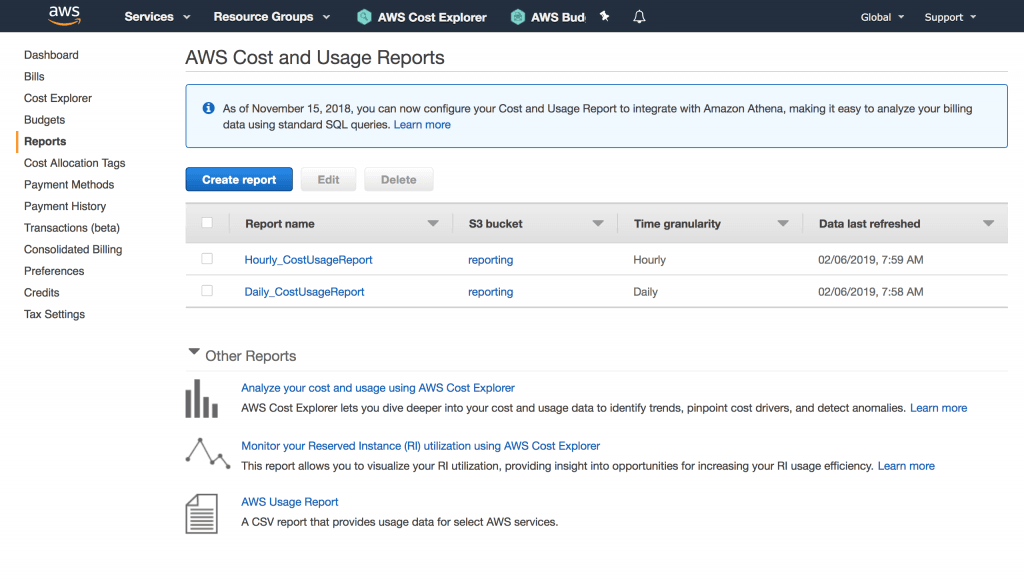
Image Source: AWS
- Go to the Billing and Cost Management console at https://console.aws.amazon.com/billing/home#/ and sign in to your account.
- Go to the navigation pane, select Cost & Usage Reports, and choose the Create report option.
- In the Report name field, enter a descriptive name.
- Go to Additional report details, and choose the Include resource IDs option to add the IDs of each resource to your report.
- Go to Data refresh settings, specify if you want the report to refresh when AWS applies credits, support fees, or refunds when finalizing the bill, and select Next.
- Go to S3 bucket, and select Configure.
- Go to the Configure S3 Bucket box and choose a bucket from the drop-down (if you want an existing bucket) or specify a name region for a new bucket name. Choose Next.
- Review the displayed bucket policy, select the confirmation option I have confirmed that this policy is correct, and select Save.
- Go to the Report path prefix and enter a report path prefix to attach to your report’s name.
- Go to Time granularity, and select whether you want AWS to aggregate line items in the report on an hourly, daily, or monthly basis.
- Go to Report versioning, and opt in to overwrite previous report versions with the new version or add any new version in addition to previous versions.
- Go to Enable report data integration for, and choose whether to enable your reports to integrate with Amazon QuickSight, Amazon Redshift, or Amazon Athena.
- Review the settings for the report, and then select Review and Complete.
Automatically Optimizing AWS Costs with Spot
While AWS offers Savings Plans, RIs and spot instances for reducing EC2 costs, these all have inherent challenges:
- Spot instances can be 90% less expensive than on-demand instances, however, as spare capacity, AWS can reclaim those instances with just a two minute warning, making them less than ideal for production and mission-critical workloads.
- AWS Savings Plans and RIs can deliver up to 72% cost savings, but they do create financial lock-in for 1 or 3 years and if not fully utilized can end up wasting money instead of saving it.
Spot addresses these challenges, allowing you to reliably use spot instances for production and mission-critical workloads as well as enjoy the long-term pricing of RIs without the risks of long-term commitment.
Key features of Spot’s cloud financial management suite include:
- Predictive rebalancing—identifies spot instance interruptions up to an hour in advance, allowing for graceful draining and workload placement on new instances, whether spot, reserved or on-demand.
- Advanced auto scaling—simplifies the process of defining scaling policies, identifying peak times, automatically scaling to ensure the right capacity in advance.
- Optimized cost and performance—keeps your cluster running at the best possible performance while using the optimal mix of on-demand, spot and reserved capacity.
- Enterprise-grade SLAs—constantly monitors and predicts spot instance behavior, capacity trends, pricing, and interruption rates. Acts in advance to add capacity whenever there is a risk of interruption.
- Serverless containers—allows you to run your Kubernetes and container workloads on fully utilized and highly available compute infrastructure while leveraging spot instances, Savings Plans and RIs for extreme cost savings.
- Intelligent and flexible utilization of AWS Savings Plans and RIs—ensures that whenever there are unused reserved capacity resources, these will be used before spinning up new spot instances, driving maximum cost-efficiency. Additionally, RIs and Savings Plans are fully managed from planning and procurement to offloading unused capacity when no longer needed, so your long-term cloud commitments always generate maximum savings.
- Visibility and recommendations—lets you visualize all your cloud spend with the ability to drill-down based on the broadest range of criteria from tags, accounts, services to namespaces, annotations, labels, and more for containerized workloads as well as receive cost reduction recommendations that can be implemented in a few clicks.
Learn more about Spot’s cloud financial management solutions