 Microsoft Azure
 Cloud Financial Management (FinOps)
 How to Operationalize FinOps
What Are AWS EC2 Logs?
AWS EC2 logs are files that store information about the operations of Amazon Elastic Compute Cloud (EC2) instances. These logs provide detailed insights concerning requests made to the EC2 instances, system errors, and other diagnostic data. By recording various activities, these logs help in monitoring the health and performance of the instances.
EC2 logs include data such as API calls, instance status changes, and network access details. They offer a granular view of the events within the EC2 services, making them useful for troubleshooting and optimizing instance operation.
In this article:
- Why Are EC2 Logs Important?
- Key Types of EC2 Logs
- What Is the Amazon CloudWatch Logs Service?
- Tutorial: Getting Started with Amazon CloudWatch Logs
Why Are EC2 Logs Important?
EC2 logs enable administrators to debug issues, monitor server performance, and ensure security compliance. The logs give real-time information about the state of applications and underlying infrastructure, which helps in proactive maintenance and management.
These logs also provide historical data, which can be used for auditing purposes. Reviewing past activities logged can aid in understanding the sequence of events leading up to an issue or breach. This makes it easier to devise an effective response.
Key Types of EC2 Logs
AWS supports several types of logs for EC2.
System Logs
System logs in EC2 document interactions at the operating system level. They are vital for diagnosing issues with the operating system or failures during the initial instance startup. These logs track system events like boot processes, system errors, and other system-level activities.
Having access to system logs allows system administrators to detect and address problems related to the operating system that might affect the performance of an EC2 instance. This can be particularly useful in instances where the system behaves unpredictably or fails to boot.
Related content: Read our guide to AWS EC2 backups
Instance Logs
Instance logs provide a record of events related to individual EC2 instances. They include information about operations performed on the instances such as start, stop, and termination. Additionally, these logs capture detailed data about instance performance and runtime issues.
These logs are useful for application troubleshooting and performance tuning. By analyzing instance logs, administrators can pinpoint application-specific issues, ranging from resource allocation to error exceptions during runtime. This enables them to make informed decisions for optimizing instance performance.
API Logs
API logs primarily document the API calls made to the Amazon EC2 service. This includes actions initiated by the user, third-party applications, or AWS services on your behalf. The logs record details of the API call, including the caller identity, time of call, source IP, request parameters, and response elements.
Understanding these logs is important for security auditing and tracking how EC2 resources are managed and accessed. They help identify unexpected actions or unauthorized access attempts.
Related content: Read our guide to EC2 instance types
What Is the Amazon CloudWatch Logs Service?
Amazon CloudWatch Logs is a cloud service designed to monitor, store, and access log files from Amazon EC2 instances, AWS CloudTrail, and other sources. CloudWatch Logs offers real-time log data collection and analysis, which enhances operational visibility across AWS cloud resources.
This service allows users to filter and retrieve log data based on custom-defined metrics, simplifying the process of system and application log analysis. For example, users can easily track high error rates or unusual system behavior, enabling quicker response times.
Tutorial: Getting Started with Amazon CloudWatch Logs
Here’s a quick introduction to how to use CloudWatch Logs.
Install the CloudWatch Agent
To install the CloudWatch agent on Amazon Linux 2023 and Amazon Linux 2, you can use the following command:
sudo yum install amazon-cloudwatch-agent
Before installing, ensure that the instance’s IAM role is equipped with the CloudWatchAgentServerPolicy. This setup is crucial for the agent’s operation, enabling it to perform its monitoring tasks effectively.
Also, ensure TCP ports 8125 and 25888 are open before starting the agent, and confirm that collectd is installed. Otherwise, use the following command to install it:
yum install collectd
For other supported operating systems, such as various Linux distributions and Windows Server, the CloudWatch agent can be installed using a command line with a download link from Amazon S3, through Amazon EC2 Systems Manager, or via an AWS CloudFormation template. These methods provide flexibility depending on the user’s operational environment and preferences.
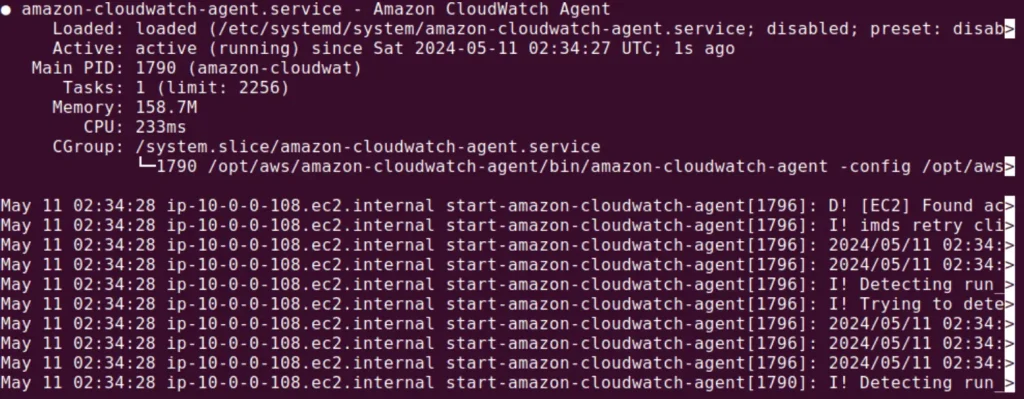
You can check if agent is running with the following command:
systemctl status amazon-cloudwatch-agent
If it is running correctly, the output should look like this:
Run a Query
To start using CloudWatch Logs Insights, you must already have log groups and streams set up in your account. These may include logs from AWS CloudTrail, Amazon Route 53, or Amazon VPC. The initial step involves running a sample query to retrieve the most recent log events.
Here are the steps involved in running a sample query:
- Access the query interface: Navigate to the CloudWatch console at https://console.aws.amazon.com/cloudwatch/, select Logs, and then Logs Insights.
- Setup your query: The query editor will display a default query that fetches the 20 most recent log events. Choose the log groups you wish to query from the Select log group(s) dropdown.
- Refine your query: You can narrow down the log groups by their name, account ID, or label. If using the Standard log class, CloudWatch automatically identifies data fields which can be viewed under the Fields menu.
- Select time frame: Use the time interval selector to define the period for your query, ranging from as short as 5 minutes to a custom timeframe.
- Execute the query: Hit Run to execute. The results will display the 20 latest log events, and a bar graph showing the distribution of these events over time.
Modify a Query
To enable a deeper look into the logs, make the following modifications to the query:
- Change the query limit: In the query editor, increase the limit from 20 to 50 log events and execute again.
- View the detailed results: Expand individual log events using the dropdown icon next to each to view all associated fields.
You can also add a filter to further refine the results based on specific criteria:
- Choose a field to filter by: Identify a common field from the Fields menu, such as awsRegion, which appears in most log events.
- Modify the query: Add a new line in the query editor, start with a pipe (|) followed by filter awsRegion=”us-east-1″ to focus on logs from this specific region.
- Re-run the query: With the new filter applied, the query now returns only those log events that match the filter criteria.
EC2 Query Example: Retrieve EC2 Instance Launches and Terminations
This example illustrates how to fetch log events showing when instances are launched or terminated, enabling you to monitor resource utilization patterns or potential unauthorized activities.
To run the query, go to the CloudWatch console and select Logs > Logs Insights > Relevant Log Group(s). From the Select log group(s) dropdown, choose the log groups that include EC2 instance logs. For instance, CloudTrail/DefaultLogGroup often contains this information.
Use this query to filter for EC2 instance state changes (starting or terminating):
fields @timestamp, @message
| filter @message like /RunInstances/ or @message like
/TerminateInstances/
| sort @timestamp desc
| limit 50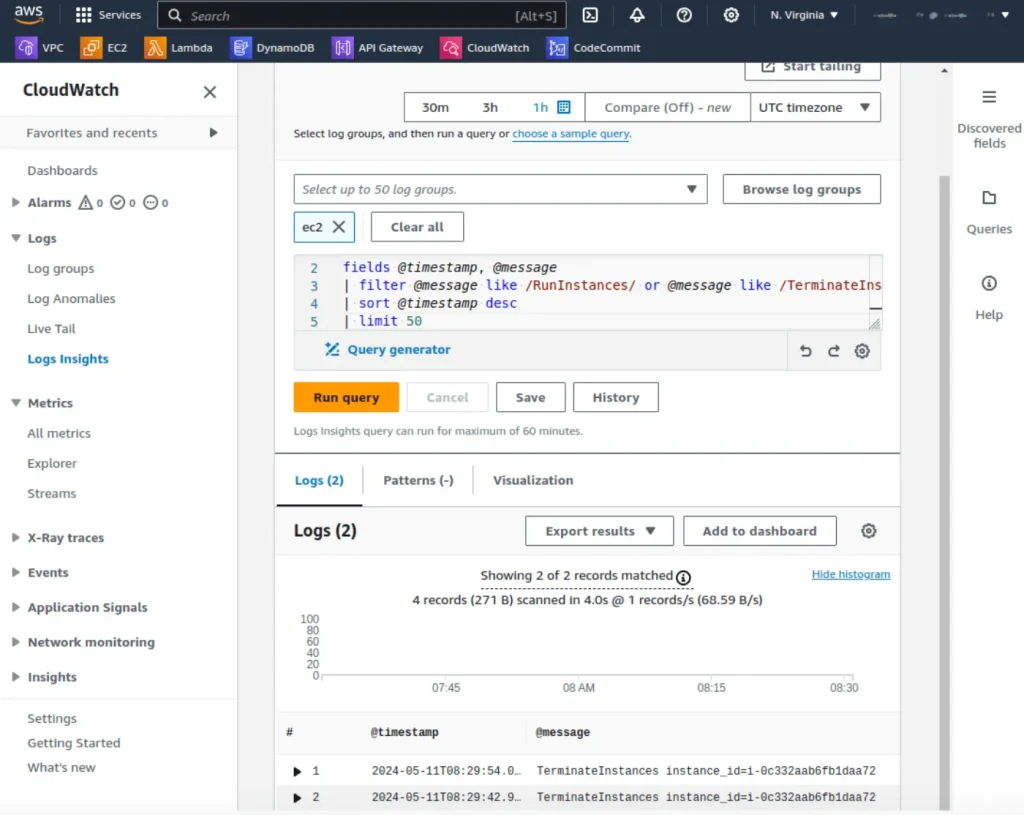
Here, @timestamp shows the time of the event, and @message captures the details of the instance’s state change.
The output will display a list of EC2 state changes. Expand any log event to see additional fields and identify the instance IDs, the AWS account involved, and the region.
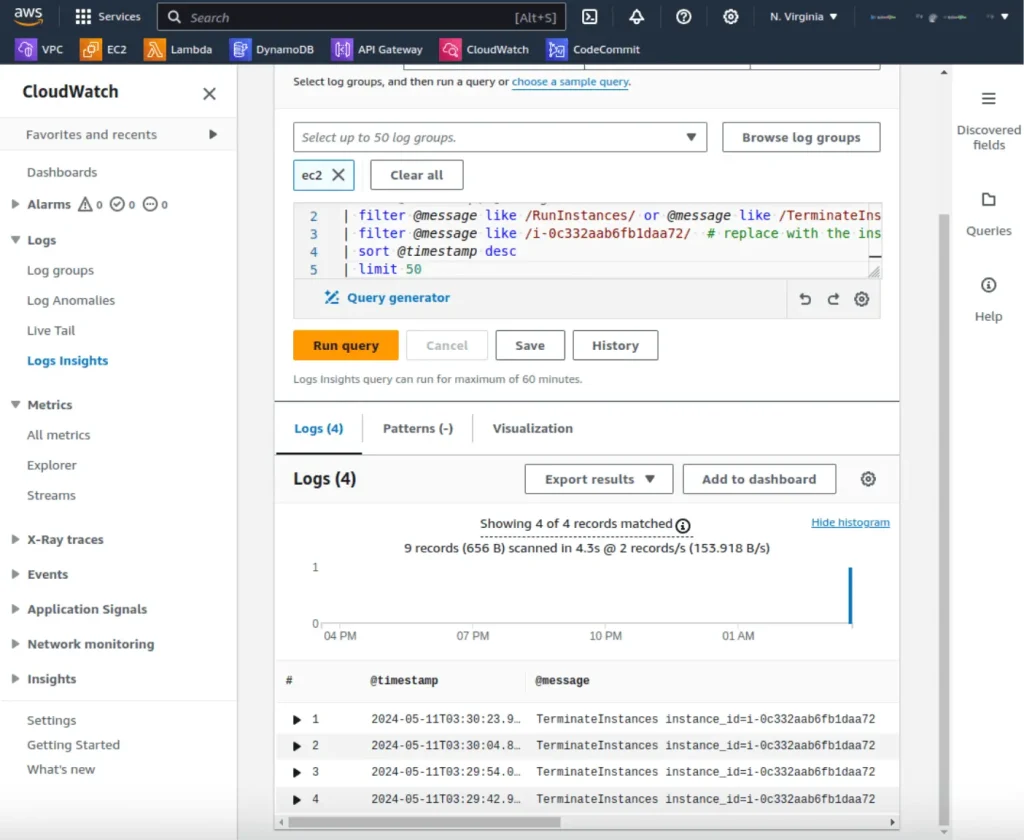
If needed, modify the query to refine the search. For instance, filter by specific instance IDs, AWS accounts, or regions:
fields @timestamp, @message
| filter @message like /RunInstances/ or @message like /TerminateInstances/
| filter @message like /i-0abcd1234ef567890/  # replace with the instance ID you want to monitor
| sort @timestamp desc
| limit 50
This version filters the results further to focus on a specific instance.
Automating AWS Cost Savings with Spot
While AWS offers Savings Plans, RIs and spot instances for reducing EC2 cost, these all have inherent challenges:
- Spot instances can be 90% less expensive than on-demand instances, however, as spare capacity, AWS can reclaim those instances with just a two minute warning, making them less than ideal for production and mission-critical workloads.
- AWS Savings Plans and RIs can deliver up to 72% cost savings, but they do create financial lock-in for 1 or 3 years and if not fully utilized can end up wasting money instead of saving it.
Spot addresses these challenges, allowing you to reliably use spot instances for production and mission-critical workloads as well as enjoy the long-term pricing of RIs without the risks of long-term commitment.
Key features of Spot’s cloud financial management suite include:
- Predictive rebalancing—identifies spot instance interruptions up to an hour in advance, allowing for graceful draining and workload placement on new instances, whether spot, reserved or on-demand.
- Advanced auto scaling—simplifies the process of defining scaling policies, identifying peak times, automatically scaling to ensure the right capacity in advance.
- Optimized cost and performance—keeps your cluster running at the best possible performance while using the optimal mix of on-demand, spot and reserved instances.
- Enterprise-grade SLAs—constantly monitors and predicts spot instance behavior, capacity trends, pricing, and interruption rates. Acts in advance to add capacity whenever there is a risk of interruption.
- Serverless containers—allows you to run your Kubernetes and container workloads on fully utilized and highly available compute infrastructure while leveraging spot instances, Savings Plans and RIs for extreme cost savings.
- Intelligent and flexible utilization of AWS Savings Plans and RIs—ensures that whenever there are unused reserved capacity resources, these will be used before spinning up new spot instances, driving maximum cost-efficiency. Additionally, RIs and Savings Plans are fully managed from planning and procurement to offloading unused capacity when no longer needed, so your long-term cloud commitments always generate maximum savings.
- Visibility and recommendations—lets you visualize all your cloud spend with the ability to drill-down based on the broadest range of criteria from tags, accounts, services to namespaces, annotations, labels, and more for containerized workloads as well as receive cost reduction recommendations that can be implemented in a few clicks.
Learn more about Spot’s cloud financial management solutions