 Microsoft Azure
 Cloud Financial Management (FinOps)
 How to Operationalize FinOps
Serverless
Spark-on-Kubernetes
Automated cloud infrastructure and application management for Apache Spark, in your cloud account. Optimized for performance, reliability, and cost-efficiency.
The power and flexibility of Kubernetes for Spark applications—without the complexities

Save up to 90% on your total costs
Applications run on the lowest-cost, highest-performing infrastructure possible.

Increase productivity for what matters
Data teams can focus on building data applications, not managing cloud infrastructure or debugging Apache Spark issues.

Go cloud-native without the overhead
Benefit from an open and flexible containerized architecture, leveraging the best open-source technology without the complexity.


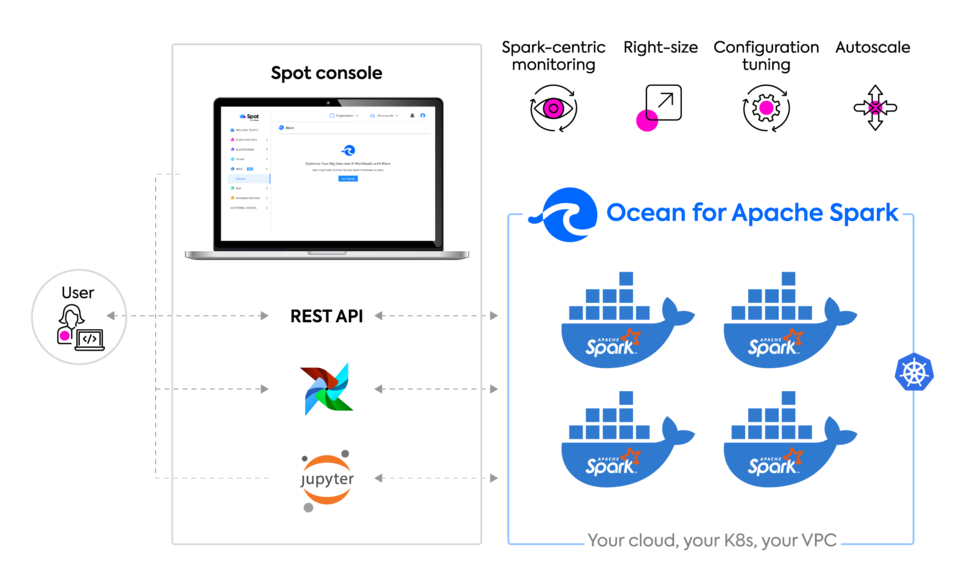
Ocean for Apache Spark
Run Spark without managing servers
Big data workloads run reliably on optimized infrastructure that’s been automatically provisioned with an optimal mix of spot, on-demand and reserved instances.
Make Spark-on-Kubernetes developer-friendly
Setup, configuration, maintenance and scaling of Spark applications and Kubernetes clusters are easy with intuitive UIs, key integrations and powerful automations.
Your cloud, your Kubernetes, your tools
Apply your security and data privacy best practices by deploying on K8s in your own cloud account and VPC. Leverage your data tools by integrating your Jupyter notebooks, IDEs, and schedulers.
What our customers say
The United Nations modernized their martime traffic data exploration while cutting costs by 70%.

Leveraging Ocean for Apache Spark decreases cost while letting us sleep well at night and achieve the plans we dream about.

EMR required too much setup and maintenance work. Databricks was expensive and was locking us in with their proprietary features. Ocean for Apache Spark was a natural fit for our technical team.

Ocean for Apache Spark automatically manages the infrastructure for our Spark pipelines. We can focus on our business, while they optimize for costs and duration.

We learned the hard way that relying on the right infrastructure is key to run our large Spark ETL jobs. We initially opted for AWS EMR, but then found a more flexible, robust, and friendlier solution.

Key features
Spark-centric monitoring and observability
Track your application’s configurations, logs, Spark UI and key metrics in our live and historical dashboard. Leverage Delight, our unique Spark-centric observability layer, to easily identify issues and improve performance of your workloads.

Spark-aware infrastructure scaling
Kubernetes clusters are automatically scaled while maintaining dynamic headroom to ensure applications can run instantaneously. Instance types and container sizes are determined to satisfy your workload requirements while maximizing bin-packing.


History-based Spark configuration tuning
The container sizes, number of executors and Spark configuration flags of your recurring pipelines are automatically tuned based on their historical performance to optimize their performance and reliability and ensure that they finish within their SLA.

Run reliably on spot instances
Save on cloud compute by leveraging spot instances with Ocean’s enterprise-grade SLA for performance and reliability. Track your cloud costs, broken down by each user and each job, in real-time within our dashboard.
Pricing
Our serverless pricing only kicks in when Spark cores are running. There’s no rounding, no hidden fee, and the support from our team of Spark experts is included.

Pay-as-you-go
Get all of Ocean for Apache Spark features and optimizations
$0.025 per Spark core hour
Month-to-month with no annual commitment
Enterprise plan
Custom integrations and customer success packages
Price depends on volume
Yearly contract