 Microsoft Azure
 Cloud Financial Management (FinOps)
 How to Operationalize FinOps
What Is Container Monitoring?
Container monitoring is the process of collecting, analyzing, and visualizing metrics from containerized applications. It enables teams to track the health and performance of containers, ensuring they operate within specified parameters. This involves gathering data on various metrics, including resource usage, such as CPU and memory, and operational metrics, like throughput and error rates.
Effective container monitoring provides insights into the behavior of applications in real time, allowing teams to detect and address issues promptly. It is essential for maintaining the performance and availability of applications, particularly in dynamic and complex environments where containers are frequently created and terminated.
This is part of a series of articles about container security.
In this article:
- Why Is Container Monitoring Important?
- Why Is Container Monitoring Difficult?
- Common Features of Container Monitoring Tools
- Notable Container Monitoring Tools
Why Is Container Monitoring Important?
Container monitoring is crucial for ensuring the performance and reliability of containerized applications. It enables teams to identify issues before they impact users, helping maintain a high level of service quality. By providing visibility into container operations, it helps in optimizing resources, reducing costs, and improving efficiency.
Container monitoring is also important for security and compliance. It helps detect anomalies and security threats, enabling timely responses. For businesses, it supports scaling by allowing for informed decisions based on performance trends and capacity planning.
Why Is Container Monitoring Difficult?
There are several characteristics of containers that make them challenging to monitor.
Containers Are Ephemeral
Containers can be short-lived, making it hard to track and diagnose issues. Traditional monitoring tools, designed for long-running instances, may not capture the brief lifespan of containers, leading to gaps in visibility.
To address this, monitoring solutions must be capable of rapidly discovering and monitoring containers as soon as they are deployed. This requires dynamic and automated approaches that can keep pace with the speed and scale of containerized environments.
Containers Share Resources
Containers often share the same physical and virtual resources, complicating monitoring efforts. This shared usage can lead to resource contention and performance bottlenecks that are difficult to pinpoint. Traditional monitoring tools may not provide the granularity needed to analyze shared resource utilization.
Container monitoring solutions must be able to dissect and attribute resource usage accurately among containers. Understanding resource allocation and consumption at the container level is critical for optimizing performance and ensuring fair resource distribution.
Emerging Tooling
Many organizations rely on traditional monitoring tools, which may lack the features needed for effective container monitoring. This results in a gap in visibility and control, hindering the ability to manage containerized environments effectively.
Specialized container monitoring tools are emerging to address these gaps. However, organizations need to carefully evaluate the maturity of tools, and operations teams might face a learning curve when implementing and using them.
Common Features of Container Monitoring Tools
Container monitoring solutions typically include the following capabilities.
Real-Time Monitoring
Real-time monitoring enables immediate insight into the operational status and performance of containers. It allows teams to react quickly to issues, minimizing downtime and maintaining service levels.
This capability involves continuously collecting and analyzing metrics, providing up-to-date information on container health, resource usage, and performance. It’s essential for dynamic environments where container states can change rapidly.
Configuration Monitoring
Configuration monitoring tracks changes to container configurations, helping ensure consistency and compliance with policies. It detects unauthorized or unintended changes that could impact performance or security.
This feature aids in maintaining stable and secure environments by providing visibility into configuration status and history. It supports automated rollback to known good states in case of problematic changes.
API Monitoring
API monitoring focuses on the performance and availability of APIs that containers use to interact with each other and with external services. It ensures that APIs respond correctly and within expected timeframes, supporting seamless application functionality.
Monitoring API calls helps identify bottlenecks, errors, and latency issues, facilitating optimization efforts. It’s critical for microservices architectures where applications rely heavily on inter-service communication.
Dashboards
Dashboards offer a visual interface for displaying monitoring data, providing a consolidated view of the health and performance of containerized applications. They enable quick identification of trends, issues, and resource utilization.
Customizable dashboards allow teams to tailor the monitoring experience to their specific needs, focusing on the metrics that matter most. This enhances decision-making and simplifies management of container environments.
Alerting
Alerting mechanisms notify teams of critical issues requiring immediate attention. This feature automates the detection and communication of problems, ensuring timely intervention to maintain service levels.
Effective alerting systems allow for customization of thresholds and notifications, ensuring teams receive relevant alerts without being overwhelmed by false positives or minor issues.
Anomaly Detection
Anomaly detection automates the identification of unusual behavior or patterns in container performance that could indicate problems. This leverages machine learning and statistical techniques to detect deviations from normal operations, often before they result in service disruption.
By alerting teams to potential issues early, anomaly detection supports proactive management of containerized environments. It reduces the time and effort required for manual monitoring and troubleshooting.
Recommendations
Recommendation engines provide actionable insights for optimizing container performance and resource usage. They analyze monitoring data to suggest improvements, such as scaling resources or adjusting configurations.
These recommendations support continuous improvement efforts, guiding teams toward best practices and efficient operation of containerized applications.
Related content: Read our guide to container security best practices (coming soon)
Notable Container Monitoring Tools
1. Spot
While not strictly a monitoring tool, Spot is a comprehensive tool designed to automate and optimize container infrastructure, focusing on maximizing efficiency, reliability, and cost-effectiveness for cloud-native applications. It helps CloudOps teams reduce the complexity and operational overhead associated with managing container infrastructure.
Key features include:
- Automated infrastructure: Utilizes advanced analytics and automation to continuously adjust and optimize the compute infrastructure, ensuring availability, scalability, and efficiency without manual intervention.
- Container-level visibility: Provides detailed, real-time insights into container behavior and costs across various levels, from individual instances to the entire application, with drill-down capabilities for enhanced monitoring and management.
- Cost control and optimization: Employs machine learning and automation to identify and allocate the most cost-effective compute resources, from spot instances to reserved and on-demand options, reducing compute costs by up to 90%.
- Predictive auto scaling: Features container-driven, predictive auto scaling of nodes to meet performance and availability requirements, ensuring resources are always available for containers to rapidly scale up or down as needed.
- Serverless container infrastructure with Ocean: Ocean by Spot offers continuous monitoring and optimization of container infrastructure, aiming to maximize efficiency and minimize costs.
Learn about Spot for container infrastructure
2. Prometheus
Prometheus is an open-source monitoring solution that powers metrics and alerting for cloud native applications. Its data model, query language, and integration capabilities are designed to collect and process metrics quickly, providing insights that help maintain the reliability and efficiency of software systems.
Key features include:
- Dimensional data: Implements a dimensional data model, where time series are identified by a metric name and a set of key-value pairs, enabling precise tracking and categorization of metrics.
- Powerful queries: Features PromQL, a flexible query language that allows users to slice and dice collected time series data for generating ad-hoc graphs, tables, and alerts, offering insights into system performance.
- Visualization: Offers multiple modes for data visualization, including a built-in expression browser for quick insights, Grafana integration for advanced analytics, and a console template language for custom views.
- Efficient storage: Utilizes an efficient custom format for storing time series both in memory and on local disk. Scaling is facilitated through functional sharding and federation, optimizing resource usage and performance.
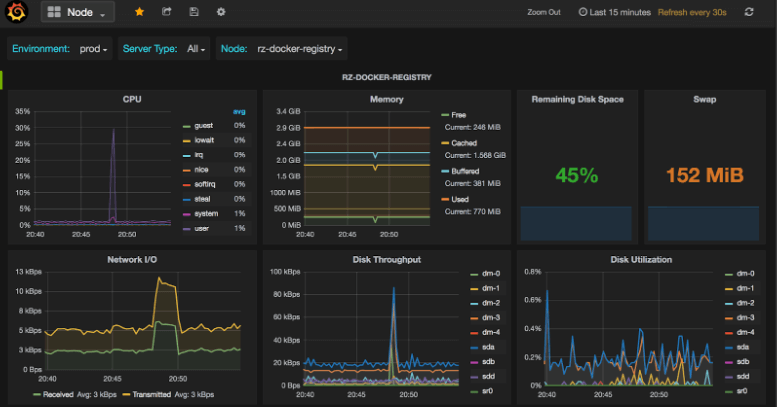
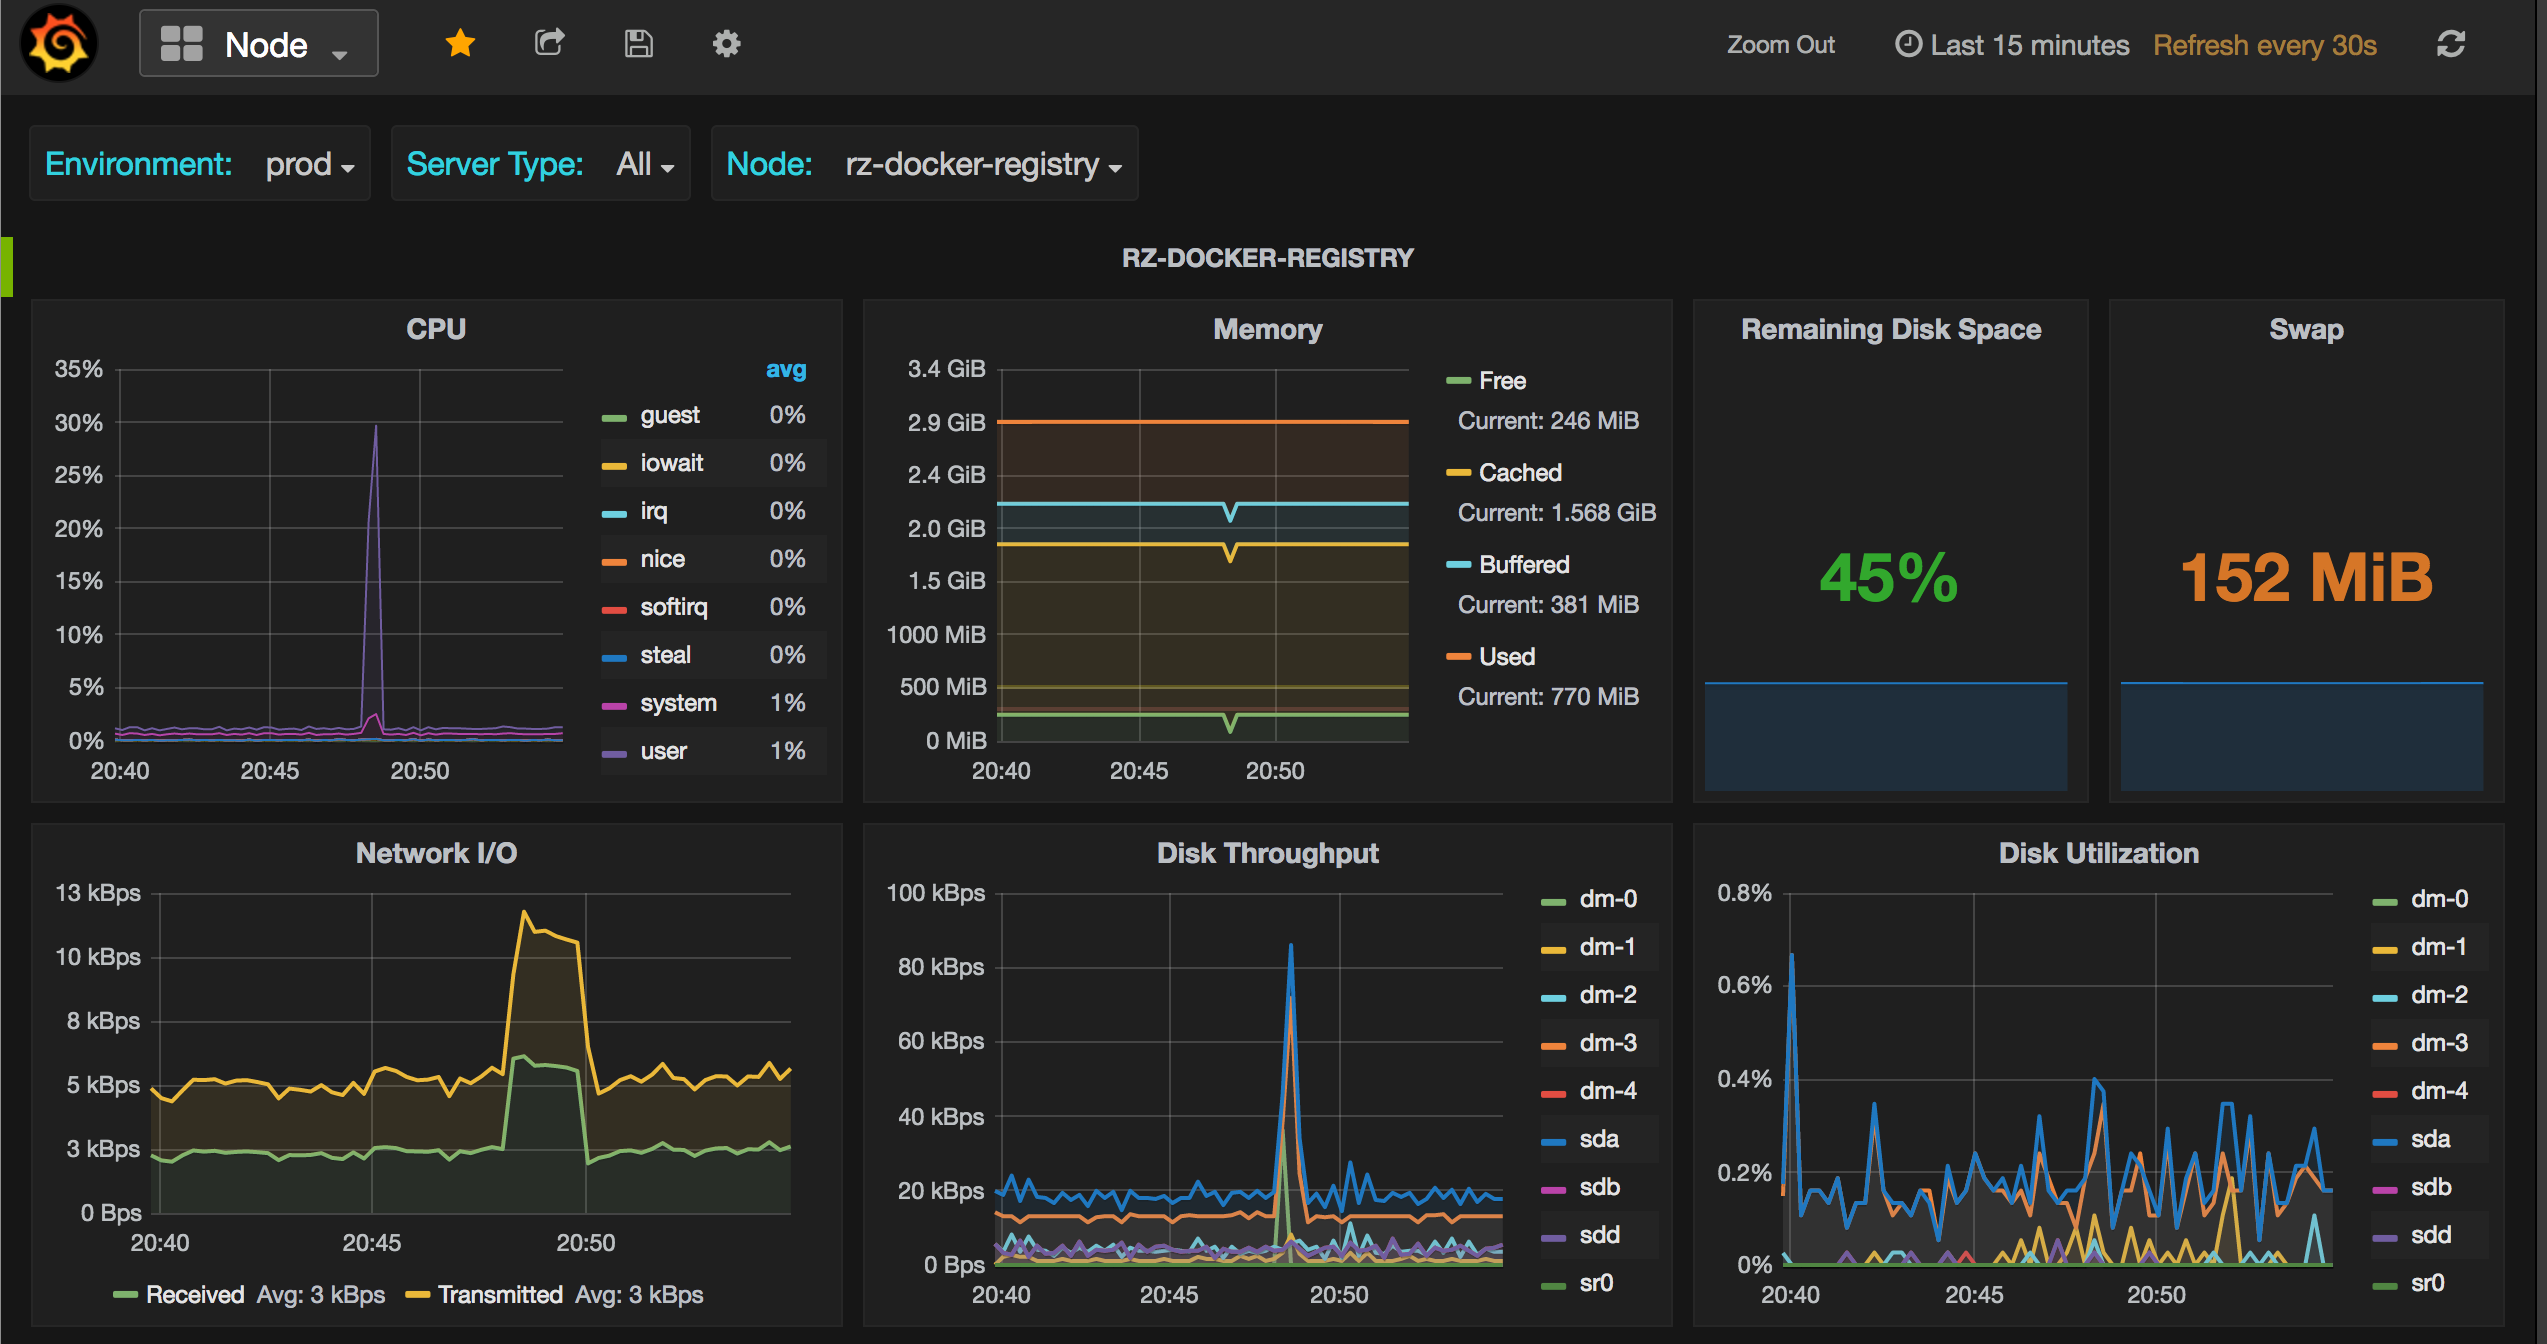
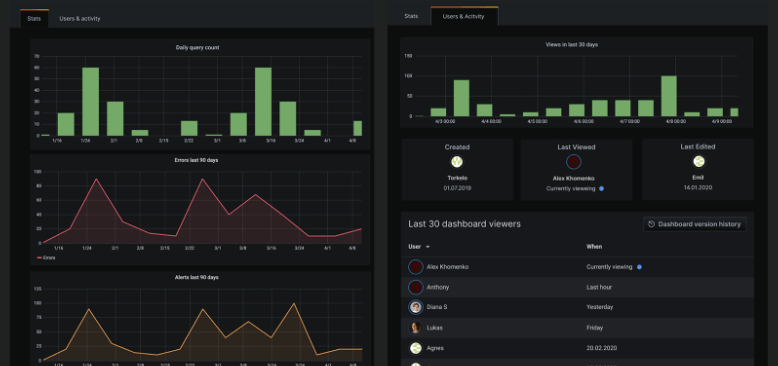
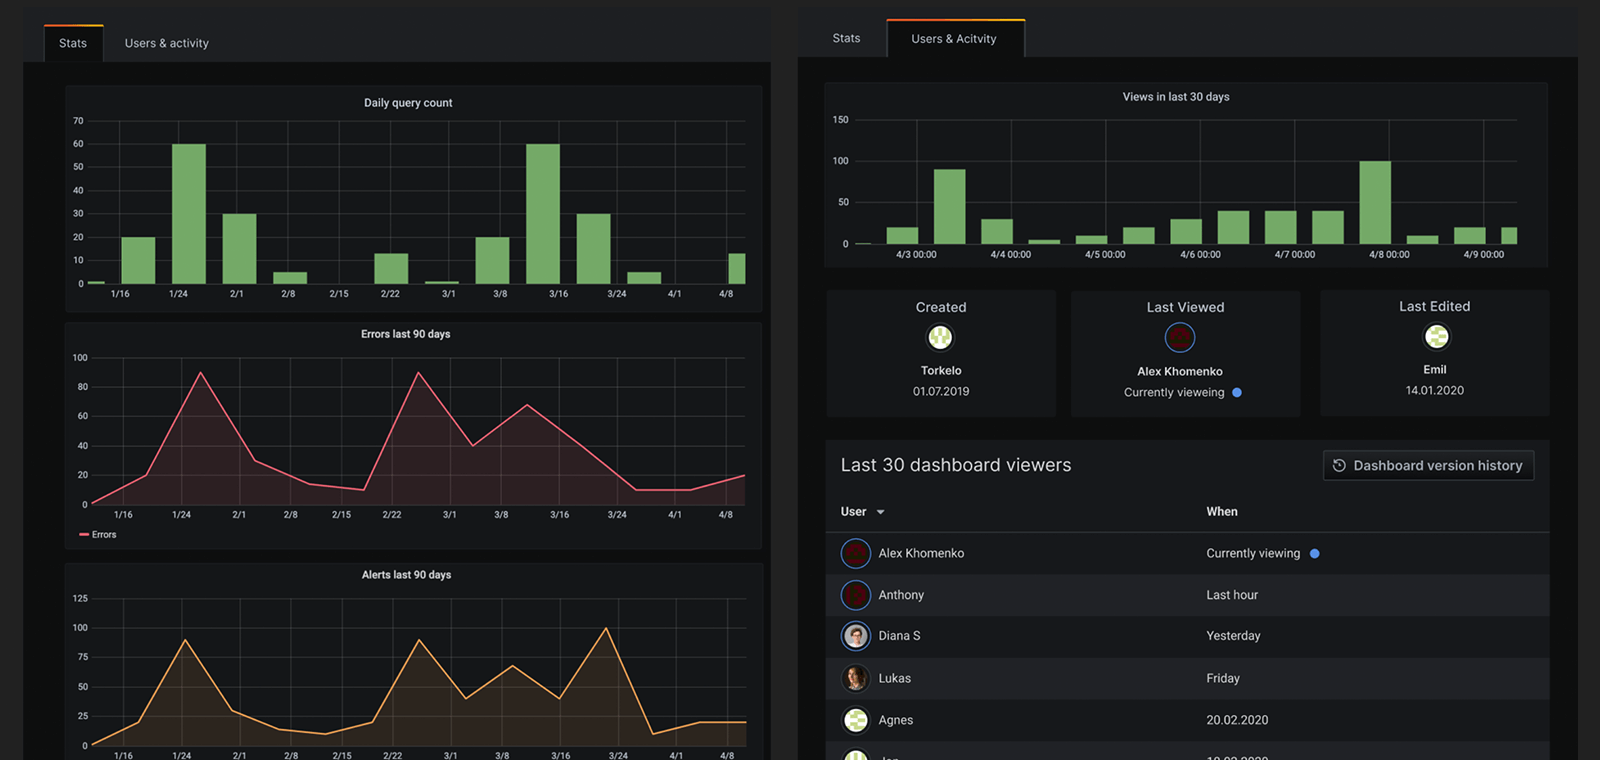
3. Grafana
Grafana is an open-source platform designed for monitoring, visualizing, and analyzing metrics, logs, and traces from multiple sources. Grafana enables users to create insightful and interactive dashboards that help in understanding complex datasets. Its plugin ecosystem allows integration with a range of data sources, including time-series databases, SQL/NoSQL databases, and other services.
Key features include:
- Query, visualize, and alert: Grafana allows users to query, visualize, alert on, and explore their metrics, logs, and traces wherever they are stored, turning data into actionable insights.
- Visualization options: Offers tools to convert time-series database (TSDB) data into informative graphs and visualizations, with support for creating playlists and dashboards tailored to specific needs.
- Plugin framework: Features a plugin framework that supports connections to other data sources, including NoSQL/SQL databases, ticketing tools (e.g., Jira, ServiceNow), and CI/CD tooling (e.g., GitLab).
- Flexible alerts: Supports a variety of alert notifiers like PagerDuty, SMS, email, and Slack, and allows for custom alert hooks for unique communication channels.
- Annotations: Enables annotating graphs with events from different data sources for better correlation of data during incidents.
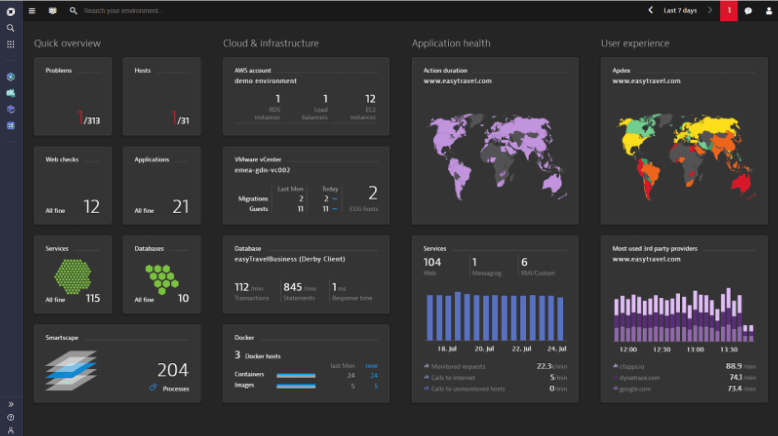
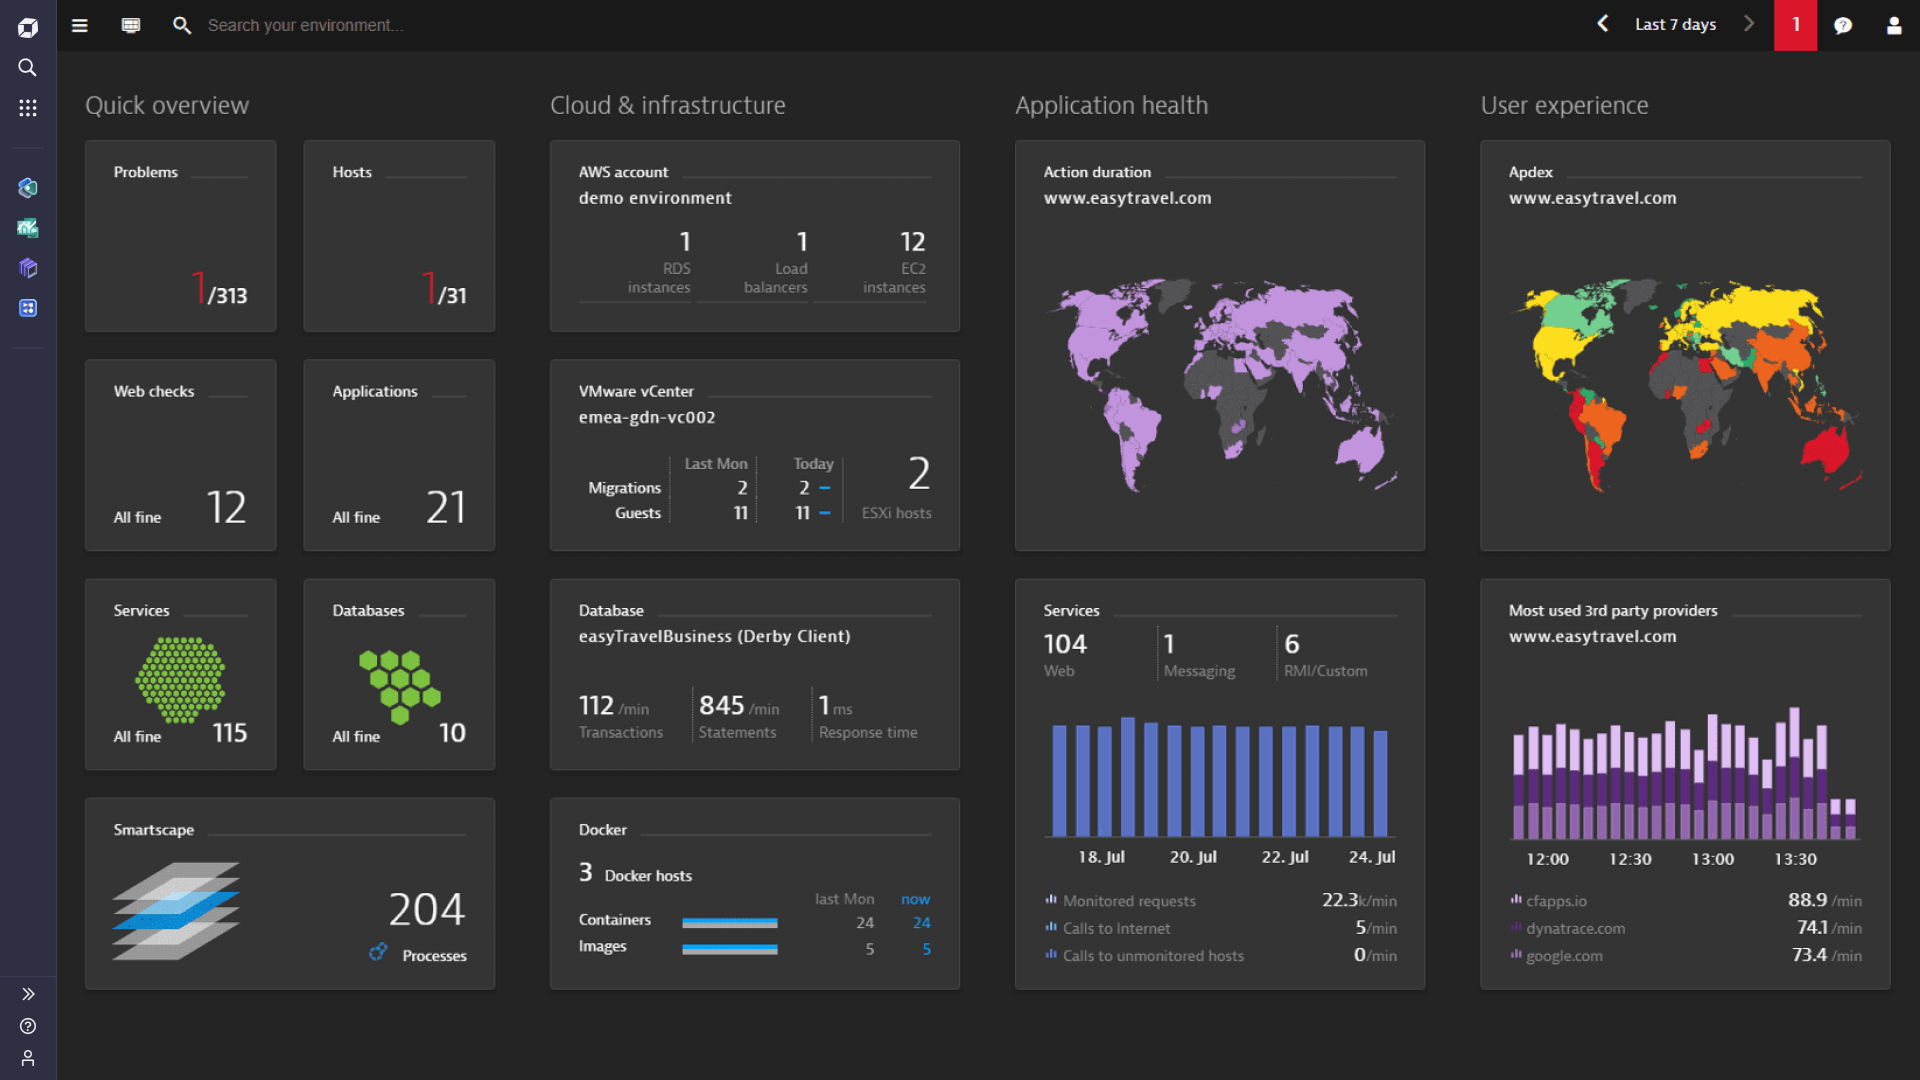
4. Dynatrace
Dynatrace is a monitoring solution focusing on observability into dynamic container environments. It is designed to tackle the challenges of monitoring Docker containers by providing DevOps and container platform teams with actionable insights and automatic problem remediation. Dynatrace simplifies container monitoring by automating the collection of metrics, traces, logs, and other observability data.
Related content: Read our guide to docker security.
Key features include:
- Automatic workload instrumentation: Enables data collection and transaction tracing without blind spots in multicloud and hybrid environments, focusing on automation and innovation.
- Single agent solution: Requires only one agent regardless of the technology stack within the Docker containers, eliminating the need to modify container images or code.
- Auto discovery of containers: Automatically identifies and maintains a real-time topology of the container environment, discovering all containers and their contents, and keeping the topology up-to-date as containers are spun up or down.
Coverage: Offers detailed insights beyond simple infrastructure metrics, including application performance, user experience, and business transactions, regardless of the technologies used to orchestrate and run containers.
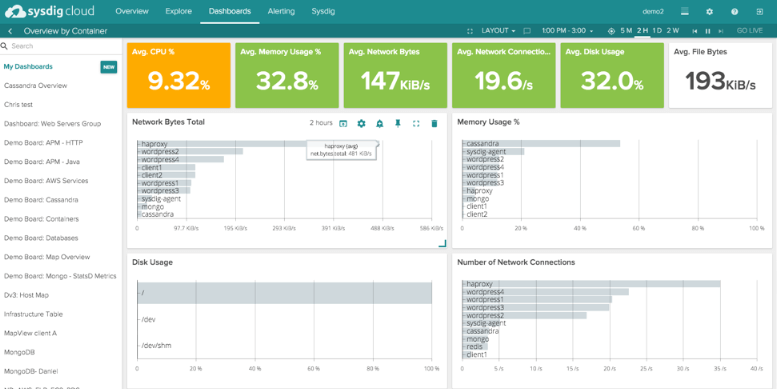
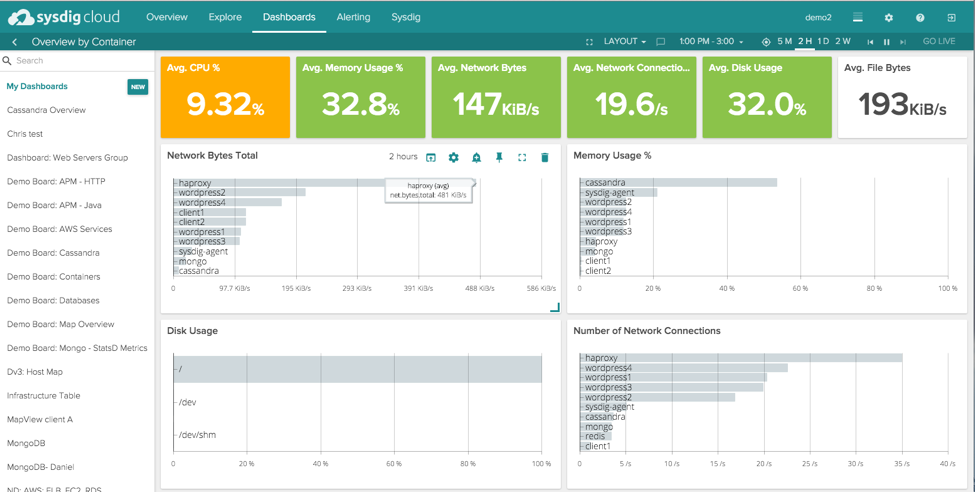
5. Sysdig
Sysdig is designed to enhance security, compliance, and performance monitoring for containerized environments. It facilitates monitoring across applications, services, and infrastructure, supporting the complexity of modern cloud-native architectures.
Key features include:
- Deep container insight: Provides granular visibility into containerized applications, enabling detailed monitoring of system calls and network activity.
- Security and compliance: With an emphasis on security, Sysdig offers features tailored for threat detection, vulnerability management, and compliance auditing.
- Performance monitoring: Monitors the performance of containers by tracking metrics such as CPU and memory usage, and network IO.
- Dashboards and alerts: Provides customizable dashboards that display key metrics and insights, helping teams quickly understand their environment’s status.
- Integration and scalability: Designed to integrate seamlessly with popular container orchestration tools like Kubernetes and Docker. Sysdig supports a range of environments from on-premises to the cloud, with a scalable architecture that can accommodate growing container workloads.
6. Splunk
Splunk for Containers, part of Splunk’s popular log analytics and big data platform, offers a unified solution to gather insights across container environments and the entire microservices technology stack. Splunk aims to simplify container monitoring, ensuring quick issue resolution and minimal effort for maintaining container availability.
Related content: Read our guide to kubernetes security best practices.
Key features include:
- Splunk Connect for Docker: A certified Docker logging plugin, optimizing log consumption into Splunk via HEC. It provides a flexible setup for container or cluster-level logging, eliminating the need for log storage on Docker nodes.
- Splunk Connect for Kubernetes: An open-source, Splunk-supported collector that integrates logging, objects, and metrics collection within Kubernetes environments. It facilitates data collection through Helm deployment and the HTTP Event Collector (HEC), running natively in Kubernetes and consolidating logs, metrics, and metadata.
- Splunk official Docker images: Offers Splunk Enterprise and Splunk Universal Forwarder as Docker images, supporting various deployment configurations. It enables efficient log forwarding and data analysis, suitable for environments not relying on Docker JSON Driver & Journald for log sources.
- Coverage: Splunk provides visibility across the technology stack, from infrastructure metrics to application performance and user experience, catering to Splunk admins, container platform engineers, and DevOps teams.
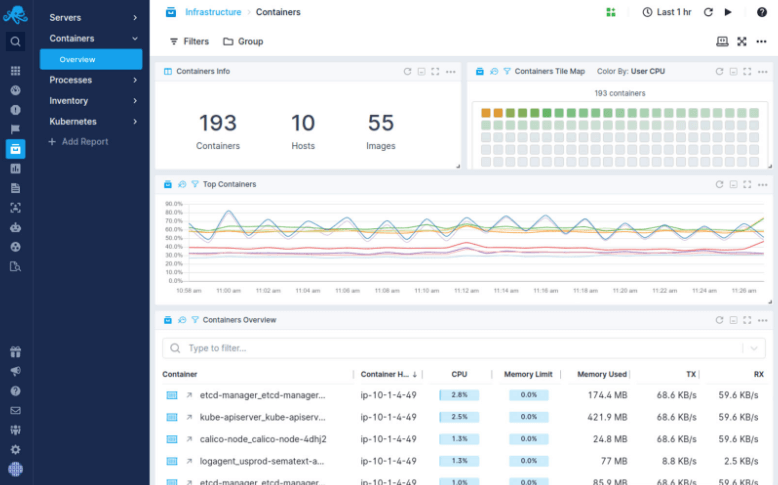
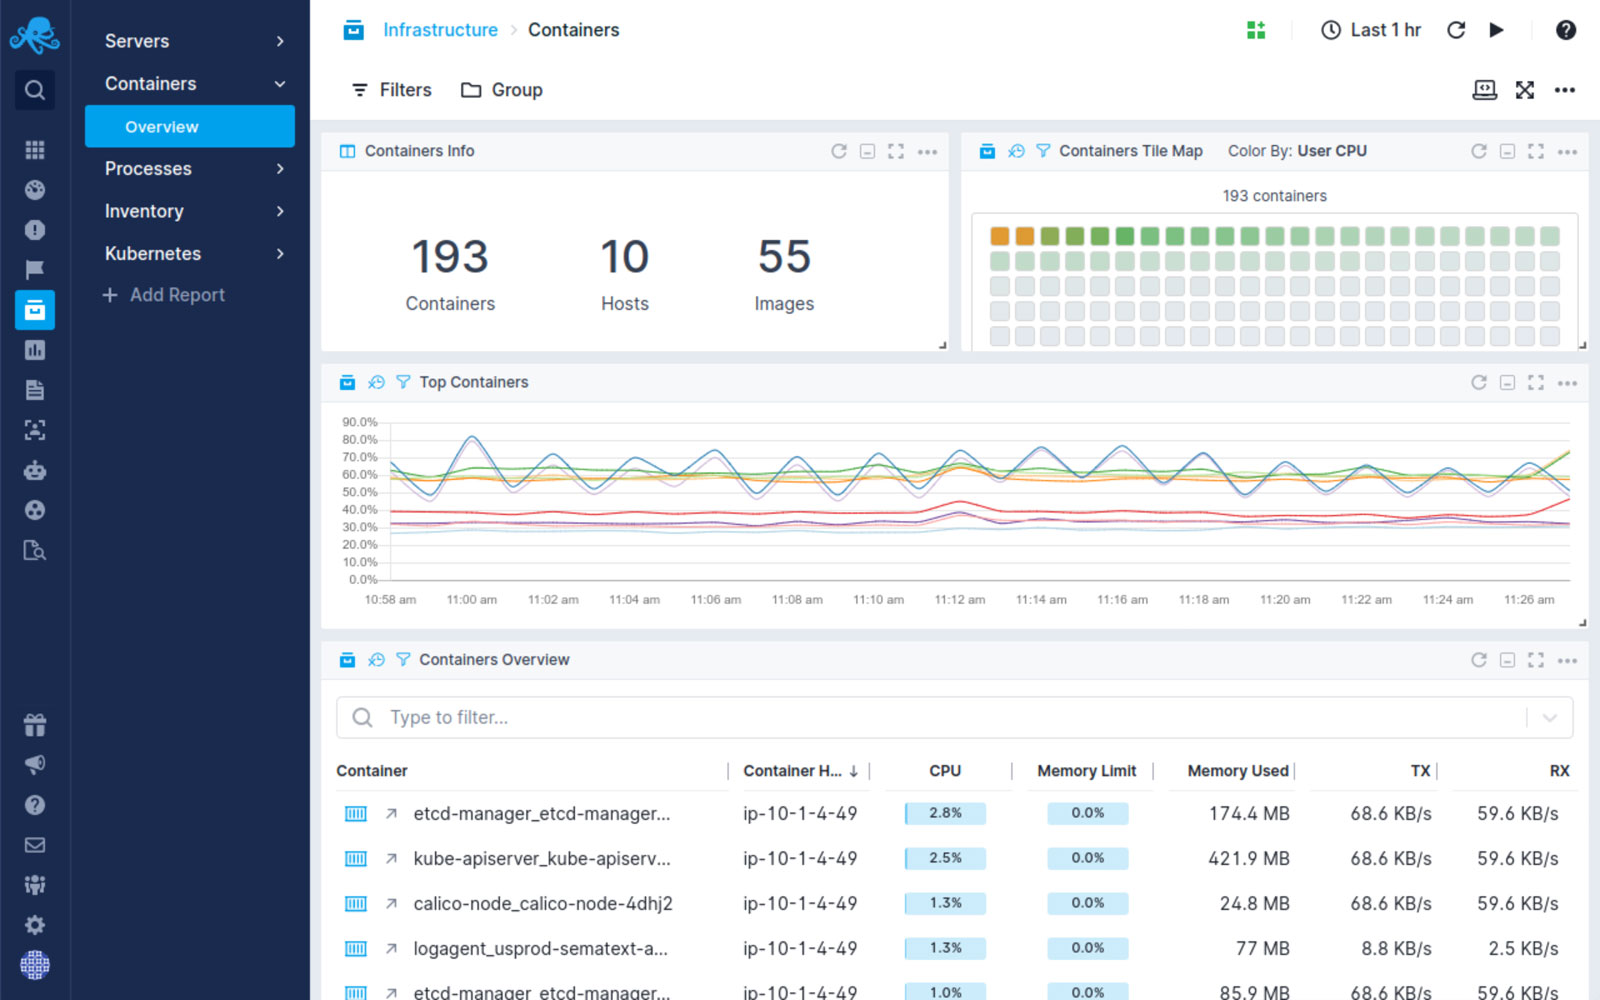
7. Sematext
Sematext offers a scalable and native container monitoring solution designed to provide in-depth visibility into the health and performance of your distributed infrastructure. It features a lightweight monitoring agent that collects metrics from both hosts and containers, facilitating oversight of your containerized environment.
Key features include:
- Native and lightweight agent: Sematext Agent operates as a minimal footprint container, capable of collecting metrics, logs, and events across various environments such as Kubernetes, Docker Swarm, and Rancher.
- In-container service auto-discovery: Automatically identifies and monitors applications running in containers, ensuring dynamic environments are continuously tracked without manual configuration. Agents start automatically upon application discovery, with customizable templates for tailored monitoring.
- Real-time container data: Provides real-time insights into container performance, from server compute metrics to identification of “hot” containers and top processes. Features like the Top Containers view and real-time Kubernetes metrics facilitate quick troubleshooting and optimization.
- Unified container monitoring: Enables correlation of container metrics, logs, and traces within a single dashboard. It automatically collects and structures logs, making them easily searchable for troubleshooting and analytics, and allows for combined metrics and logs alerting.
Conclusion
In conclusion, container monitoring is an indispensable component in managing and operating containerized environments efficiently and securely. It addresses the unique challenges posed by containers, including their ephemeral nature, resource sharing, and the need for specialized tooling.
By leveraging the right monitoring tools, teams can gain deep insights into container performance, resource usage, and health, enabling proactive issue resolution, optimized resource allocation, and improved application reliability. As container technology continues to evolve, effective monitoring solutions are a critical area for investment and innovation.