 Microsoft Azure
 Cloud Financial Management (FinOps)
 How to Operationalize FinOps
Spot Ocean functions as an autopilot for the Kubernetes data-plane, as it delivers container-driven autoscaling to continuously monitor and optimize your cloud infrastructure for the cluster. Positioned at a busy crossroads in your application deployment pipeline, Ocean generates and maintains data in several manners/formats – data which is valuable when monitoring the containerized environment. In other words, effective monitoring of Ocean activity using well defined metrics can accelerate the understanding of the cluster topology as part of environment monitoring, or during troubleshooting scenarios.
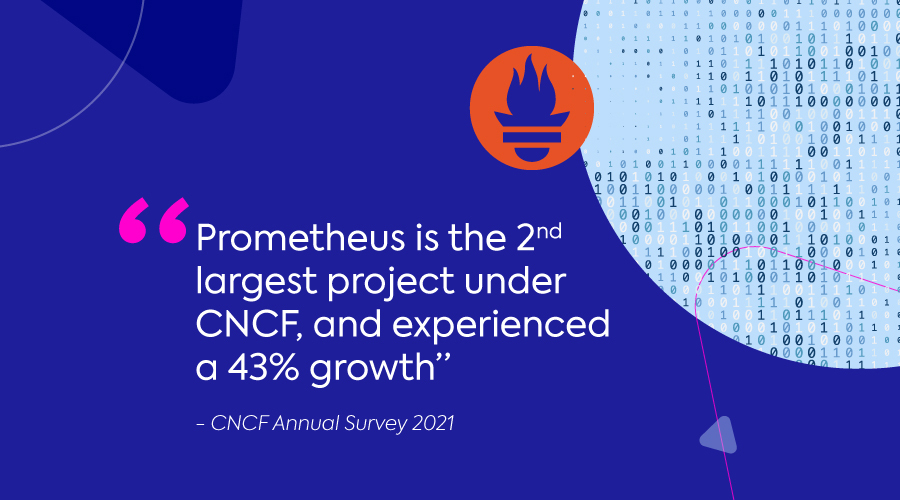
As per Kubernetes metrics monitoring, Prometheus is the go to tool. It records real-time metrics in a time series database (allowing for high dimensionality) built using a HTTP pull model, with flexible queries and real-time alerting. Prometheus is the 2nd largest project under CNCF, and experienced a 43% growth according to the 2021 CNCF survey.
As part of natively integrating Ocean data in your observability pipelines, we are very excited to share that Ocean now maintains an official set of metrics, natively scrapable by Prometheus! This set of metrics is useful in building a 360º view of the actions Ocean proactively takes to deliver application driven infrastructure.
Understanding Ocean scaling
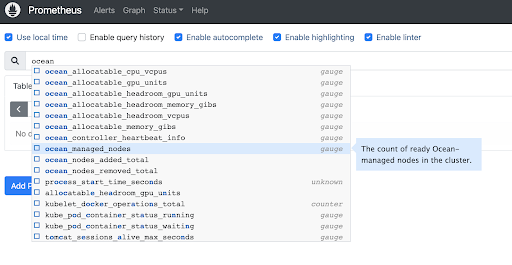
ocean_managed_nodes: this gauge typed metric tracks the total number of nodes (managed by Ocean) in the cluster. The metric could be useful to respond to unnatural anomalies, tracking daemonset overhead etc. in addition, the metric provides an easy breakdown to monitor specific virtual node groups in the cluster, as well as other infrastructure characteristics like instance lifecycle or type.
Example:
ocean_managed_nodes {VNGId="ols-xxxxxxxx", lifecycle="Spot", AZ="us-west-2a", type="c5.2xlarge", ocean-id=”o-12345678”, ocean_name=”myOceanCluster”, vng_name=”batchWorkloadsVNG”} 13
ocean_managed_nodes {VNGId="ols-xxxxxxxx", lifecycle="OD", AZ="us-west-2b", type="c5.2xlarge", ocean-id=”o-12345678”, ocean_name=”myOceanCluster”, vng_name=”batchWorkloadsVNG”} 2
ocean_managed_nodes {VNGId="ols-xxxxxxxx", lifecycle="Spot", AZ="us-west-2b", type="m5.8xlarge", ocean-id=”o-12345678”, ocean_name=”myOceanCluster”, vng_name=”batchWorkloadsVNG”} 3
ocean_nodes_added_total and ocean_nodes_removed_total: these counter typed metrics help track the rate of nodes addition/removal in the cluster and the different reasons behind them, as reflected in a dedicated label called “reason”, featuring values such as “pendingPodsOrHeadroom” (for scale up), “odToSpotReplacement” (actively replacing OD instances with Spot instances), revertToLowerCostReplacement (capturing the recently released optimization process from Ocean) and more!
ocean_nodes_added_total{reason="revertToLowerCostReplacement", lifecycle="Spot", AZ="us-west-2a", type="c5.xlarge", ocean-id=”o-12345678”, ocean_name=”myOceanCluster”, vng_name=”batchWorkloadsVNG”} 46
ocean_nodes_added_total{reason="scaleUpForPendingPods", lifecycle="Spot", AZ="us-west-2b", type="r5a.4xlarge", ocean-id=”o-12345678”, ocean_name=”myOceanCluster”, vng_name=”batchWorkloadsVNG”} 13
Tracking Ocean managed resources
ocean_allocatable_cpu_vcpus / ocean_allocatable_memory_gibs / ocean_allocatable_gpu_units
These gauge typed metrics detail the resources allocatable by all ocean-managed nodes in the cluster. The labels added to these hold the breakdown of resources from different angles and help tracking the effect of scaling operations onto the compute resources available for containers to use in the cluster.
ocean_allocatable_cpu_vcpus{VNGId="ols-xxxxxxxx", lifecycle="OD/Spot", AZ="us-west-2a", VMtype="c5.2xlarge", ocean-id=”o-12345678”, ocean_name=”myOceanCluster”, vng_name=”batchWorkloadsVNG”} 45
ocean_allocatable_headroom_cpu_vcpus / ocean_allocatable_headroom_memory_gibs / ocean_allocatable_headroom_gpu_units
In line with the previous section, these 3 metrics capture the subset of compute resources allocatable as headroom in all ocean-managed nodes in the cluster.
Prometheus metric type: gauge
ocean_allocatable_headroom_gpu_units{VNGId="ols-xxxxxxxx", lifecycle="OD/Spot", AZ="us-west-2a", VMtype="c5.2xlarge", ocean-id=”o-12345678”, ocean_name=”myOceanCluster”, vng_name=”batchWorkloadsVNG”} 12
Tracking healthiness
ocean_controller_heartbeat_info
This gauge typed metric features values of 0/1, capturing the connectivity of the Ocean controller in the cluster and the SaaS.
ocean_controller_heartbeat_info {ocean-id=”o-12345678”, ocean_name=”myOceanCluster”} 1
Scrape Ocean metrics
The metrics above are scrapable natively via Prometheus. Using a simple exporter, Ocean is able to provide metrical data in open metrics format.
The Spot Ocean metric exporter is a lightweight application running in the Kubernetes cluster that is responsible for continuously scraping metrical data from the Ocean SaaS. The scraping takes place each 60 seconds and the returned data is formatted for Prometheus to ingest.
Note that the exporter application is independent of the Ocean controller. That said, a functioning controller is needed for data to stream into Ocean SaaS and ultimately update the metrics.
Prerequisites
- Ocean up & running with a reporting controller
- Prometheus installed in the cluster
Deploy the Exporter
Via Helm
This helm chart entirely covers this step.
First, add the Spot Helm chart repository:
helm repo add spot https://charts.spot.io
Then update your local Helm chart repository cache:
helm repo update
Finally, install ocean-metric-exporter:
helm install my-release spot/ocean-metric-exporter
Via Infrastructure as Code
Alternatively, use the https://registry.terraform.io/modules/spotinst/ocean-metric-exporter/spotinst/latest Terraform module to incorporate the exporter in your IaC setup.
Configure Prometheus
This step configures Prometheus to generate scrape requests to the Kubernetes service that exposes the Ocean exporter. To the set of Prometheus jobs configured in your environment, add the following:
scrape_configs:- job_name: 'spot-ocean-metrics' # The job name is assigned to scraped metrics by default.metrics_path: '/metrics' # The HTTP resource path on which to fetch metrics from targets.scrape_interval: 30s # How frequently to scrape targets from this job.static_configs:- targets: ['spot-ocean-metric-exporter.kube-system.svc.cluster.local:5050'] #kube-system represents the namespace where the exporter service resides at
And viola! Ocean metrics will be scraped each 30 seconds and saved into Prometheus!
One popular use of metrics saved in Prometheus is dashboarding. It is safe to say that Grafana is one of the most popular tools to do that. So to take it a step further, we have created a preset Grafana dashboard, visualizing Ocean metrics, ready to be incorporated into your existing dashboard base!
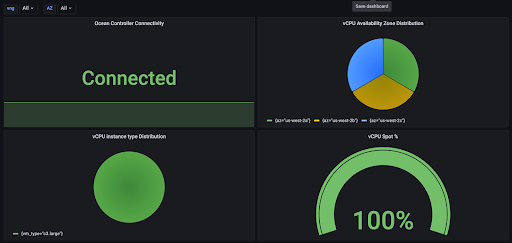
Refer to https://grafana.com/grafana/dashboards/16475 for more information and to download the dashboard template.
What’s next?
This is the first version of the exporter and set of metrics. Going forward we plan to expand the list of metrics to cover:
- infrastructure optimization
- scaling-related Ocean logs
- right sizing recommendations
- and even more yet to be determined
This is a great chance to influence the next metrics to be added! Click on the roadmap menu item inside the Ocean console and share feedback and/or make a request for future metrics.
For additional information, please refer to the Ocean documentation. Current information regarding Prometheus integration can be found under Tools & Integrations – Prometheus, and Scrape Ocean Metrics.