As Spot’s Cloud Analyzer usage grows, customer feedback is continuously being incorporated and added as new features and functionality.
Recently, we have been adding to Cloud Analyzer’s spend analysis features, enabling more filters and options for conducting focused drill-down into spend data. However, we know that the modern FinOps engineer is not only looking for data analysis, but also for tools to quickly organize and convert this often complex, highly detailed data into usable and actionable information.
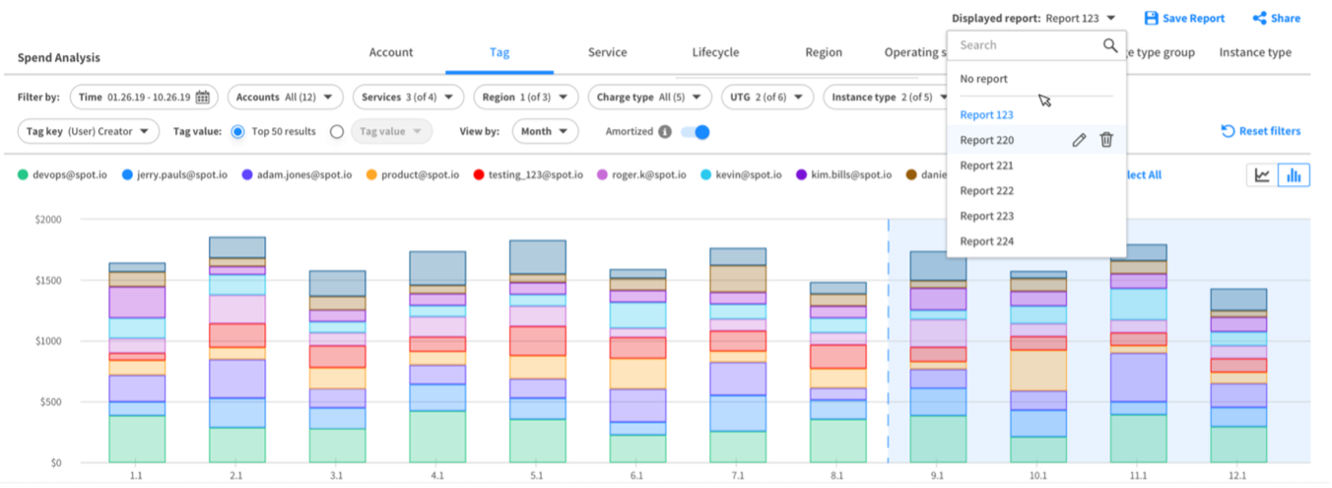
Today we are happy to announce our new Saved Reports feature, allowing users to save their spend analysis and track their costs based on pre-defined grouping and filtering.
Saved Reports improves user experience by reducing the time it takes to search and export reports for common or repeat search patterns.
Saved Reports – Main Functionality
- New reports can be created based on selected grouping and filters
- Existing reports can be opened, edited or deleted
- Data can be viewed both with existing “slice & dice” charts and tabular views
- Reports can be exported
- Saved reports are private for the user that saves them (a “share” option coming soon)


