 Microsoft Azure
 Cloud Financial Management (FinOps)
 How to Operationalize FinOps
The Spotinst DevOps Automation Platform actively optimizes the underlying compute of your cloud services for better performance at lower costs, but it can also help you get a better understanding of how your organization uses the cloud.
Our latest chart, now available in the main Elastigroup dashboard, shows you a breakdown of how your org utilizes instances over time, by instance family and Lifecycle.
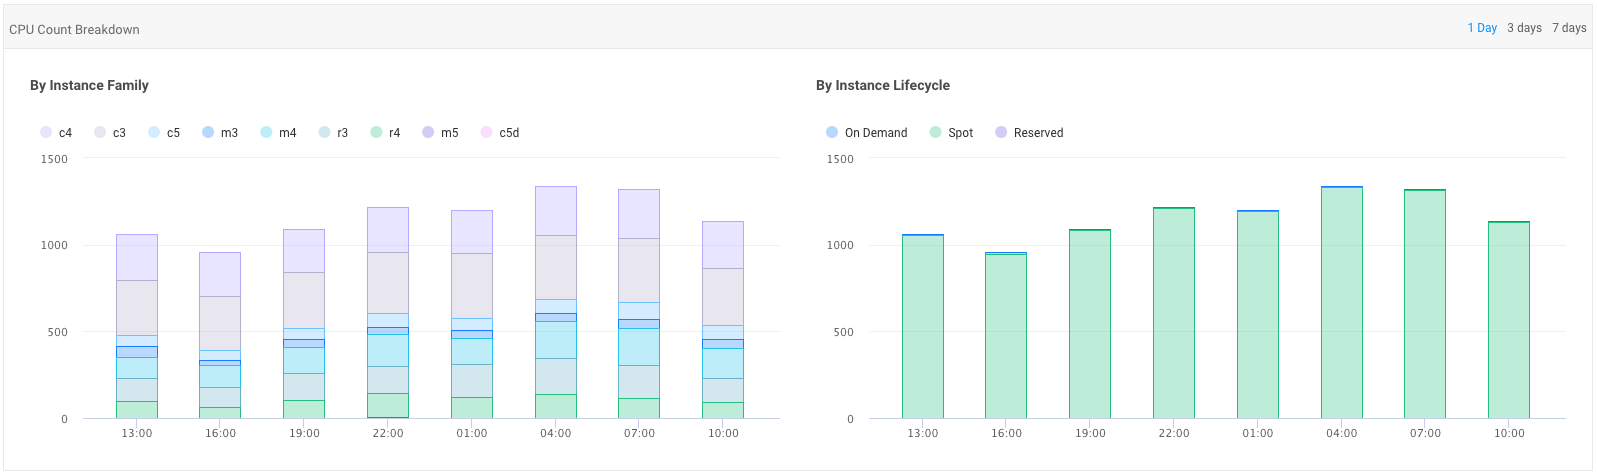
This latest report shows you more than the number of instances you’re running. You can see how many CPU cores you’re running over time with each family, and how many of those cores are running in which Lifecycle (Spot, Reserved, On-Demand).
With this chart, you can track the behaviour of your infrastructure and observe abnormal spikes and trends in your AWS accounts.
The CPU Count Breakdown Chart is available now in your Elastigroup dashboard!