 Microsoft Azure
 Cloud Financial Management (FinOps)
 How to Operationalize FinOps
One of the biggest challenges in using cloud infrastructure is the ever-increasing noise in cloud security. Therefore, it is now more important than ever to create focused risk visibility for your critical business units and business-critical applications (a.k.a. “crown jewels”).
However, creating visibility in silos does not sufficiently address the above problem. For example, prioritizing a low-severity risk in isolation is challenging without understanding the impact to the rest of the cloud environment. By using risk maps, security teams avoid performing this risk assessment with incomplete and siloed data.
Spot Security delivers visibility into business-critical applications, as well as services, policies, instances, and other entities, impacted by risks. It then contextualizes any risks and vulnerabilities detected so that you can take action, all with the click of a button.
Assess the risk posture of crown jewels
When it comes to cloud security, visibility is often the best defense. The Topology view in Spot Security gives users comprehensive visibility into the interconnections of their network and an understanding of the potential path an attacker could take to individual assets. With this feature, users can track failing security rules, affected assets, real-time events, and compliance posture.
Spot Security’s Topology feature enables users to create an asset group of their business-critical units/ applications. For example, users can create a group of all assets containing PII data and visualize in a single pane of glass whether the assets adhere to GDPR, PCI DSS, or other frameworks and identify misconfigurations.
Add context to each risk
Visibility into your cloud means nothing if you don’t understand the potential of the risks. That’s where Spot Security’s Risk Impact Maps come in, to illustrate the blast radius of each risk and how even minor gaps across your environment can lead to a breach of your crown jewels. It does this by analyzing the subnet relationships in the cloud network to uncover potential attack paths and attack surfaces in your environment. In turn, what was once opaque is now clearly visualized so that risks may be uncovered, prioritized, and remediated.
Gain actionable visibility
Spot Security’s Risk Impact Maps and Topology act as transparent windows into opaque cloud environments. Without these features, determining asset-to-asset relationships would require time-consuming manual efforts.
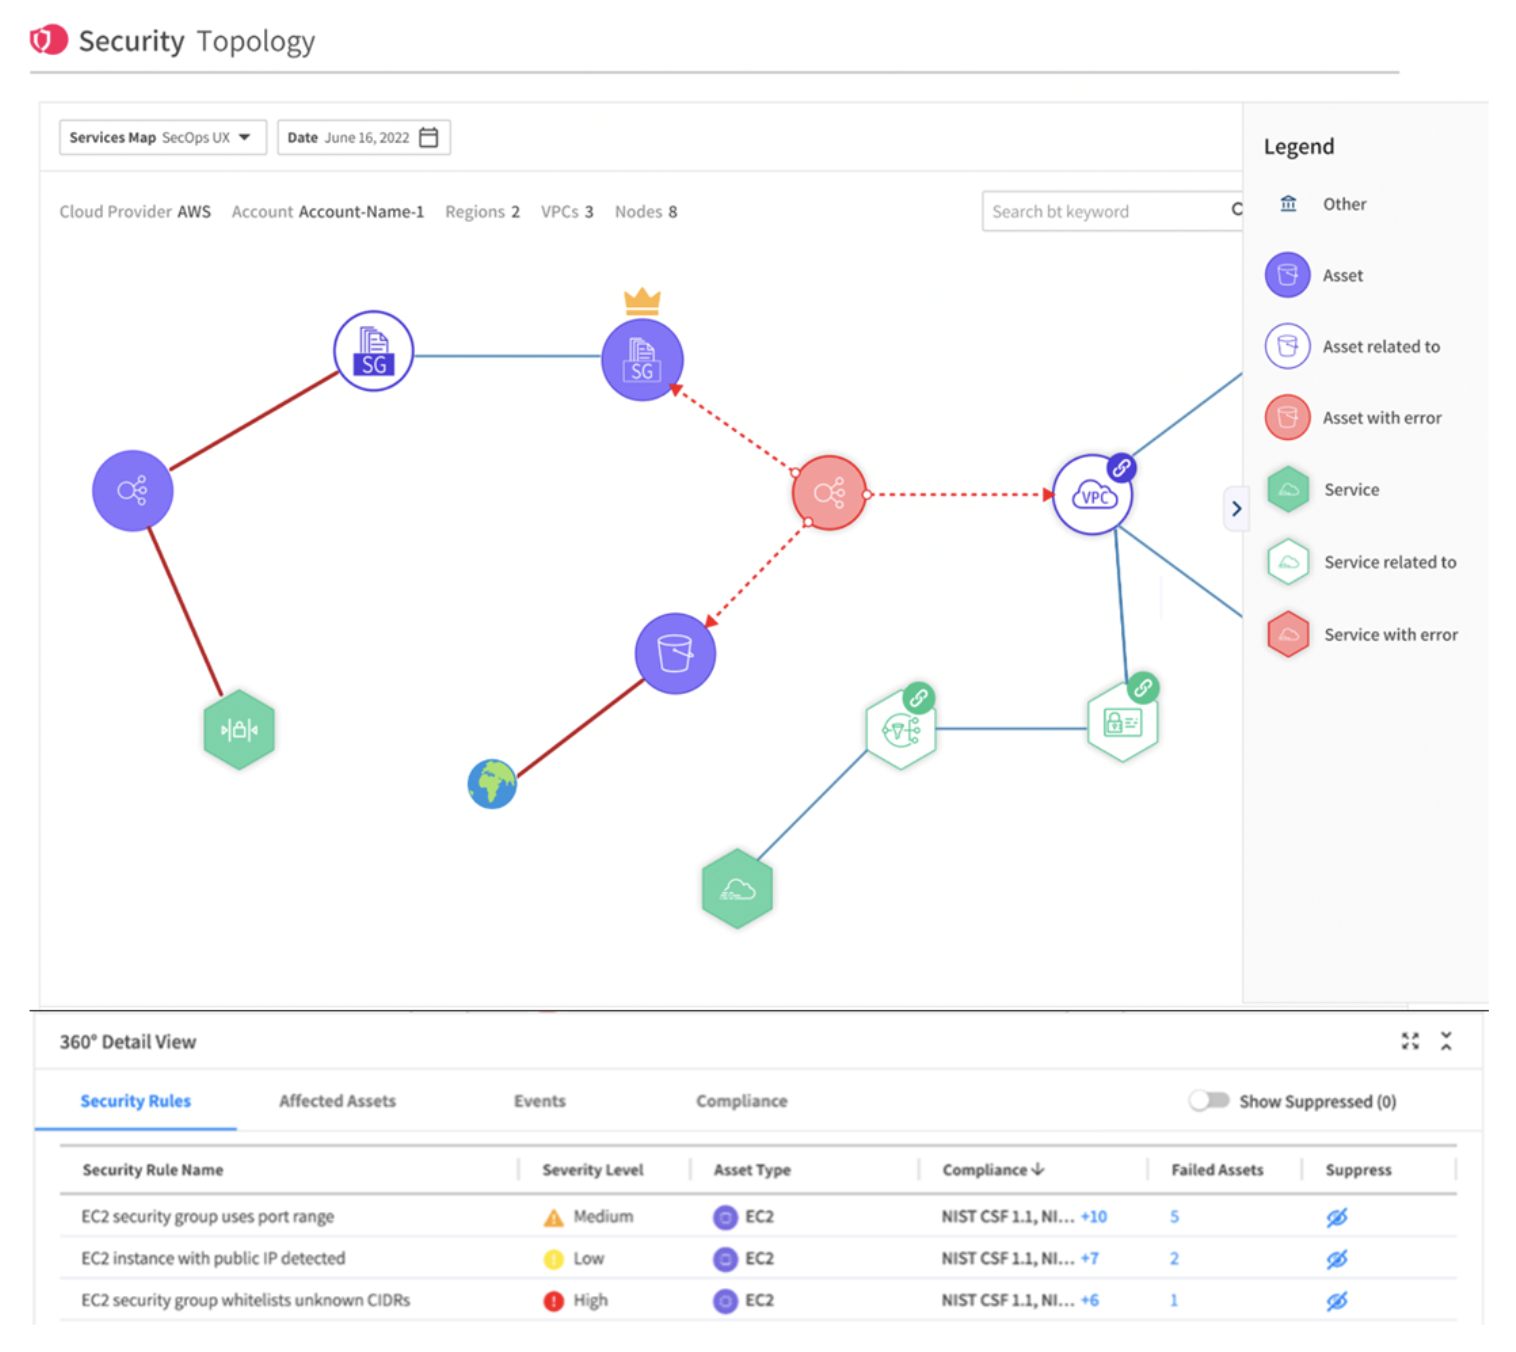
In the above example of the Spot Security Topology, you can see where a crown jewel asset (denoted with a gold crown) is connected to other resources.
Even if the crown jewel asset doesn’t have any misconfigurations, the fact that it is linked to assets with errors, as noted in the diagram, puts the crown jewel at risk, too. Users can create this actionable visualization for all business-critical assets and track their risk posture over time.
This clear visualization allows you to react quickly to any potential vulnerabilities, thereby reducing risk in your single- and multi-cloud environment. While multi-cloud and siloed environments pose inherent risks, the more you put tools like topology visualization into the hands of security teams, the more they can focus on what is important. The best way to do so is by deploying a visualization tool that is customizable, easy to use, and actionable.
Learn more about full cloud visibility with Spot Security and sign up today for your free trial.