 Microsoft Azure
 Cloud Financial Management (FinOps)
 How to Operationalize FinOps
Cloud cost management is essential for business success, especially in times of business and global volatility. However, gaining quick and clear visibility into all your containerized workloads so you can control and improve the way they are being used, has not been so simple to date.
At Spot, we have been addressing these issues and recently introduced cost analysis and showback tools for Kubernetes within our Ocean solution. This gives you the ability to drill down into your clusters’ consumption based on namespaces, resources, labels and annotations.
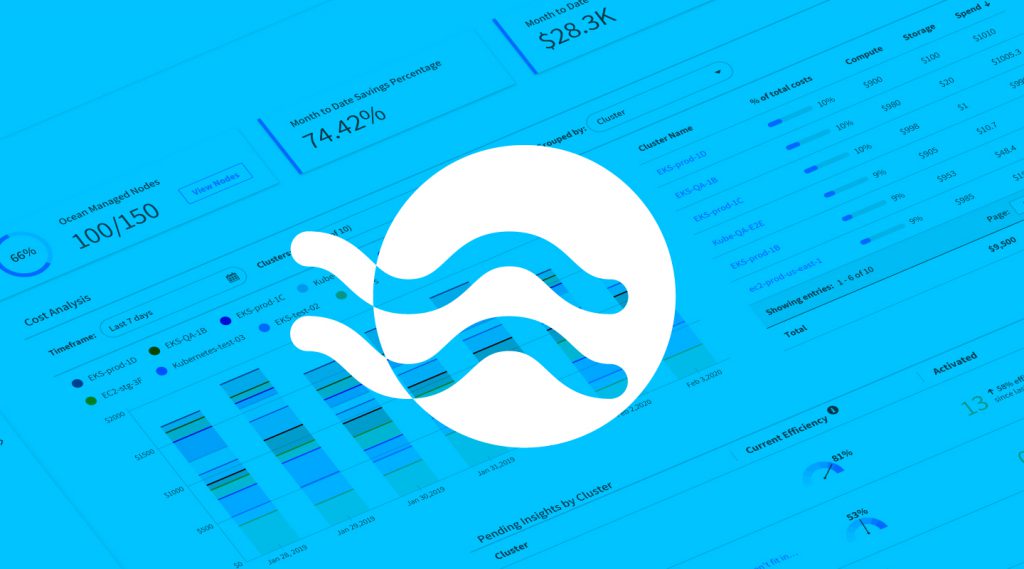
Today we are pleased to introduce our latest enhancement with Ocean’s new dashboard:
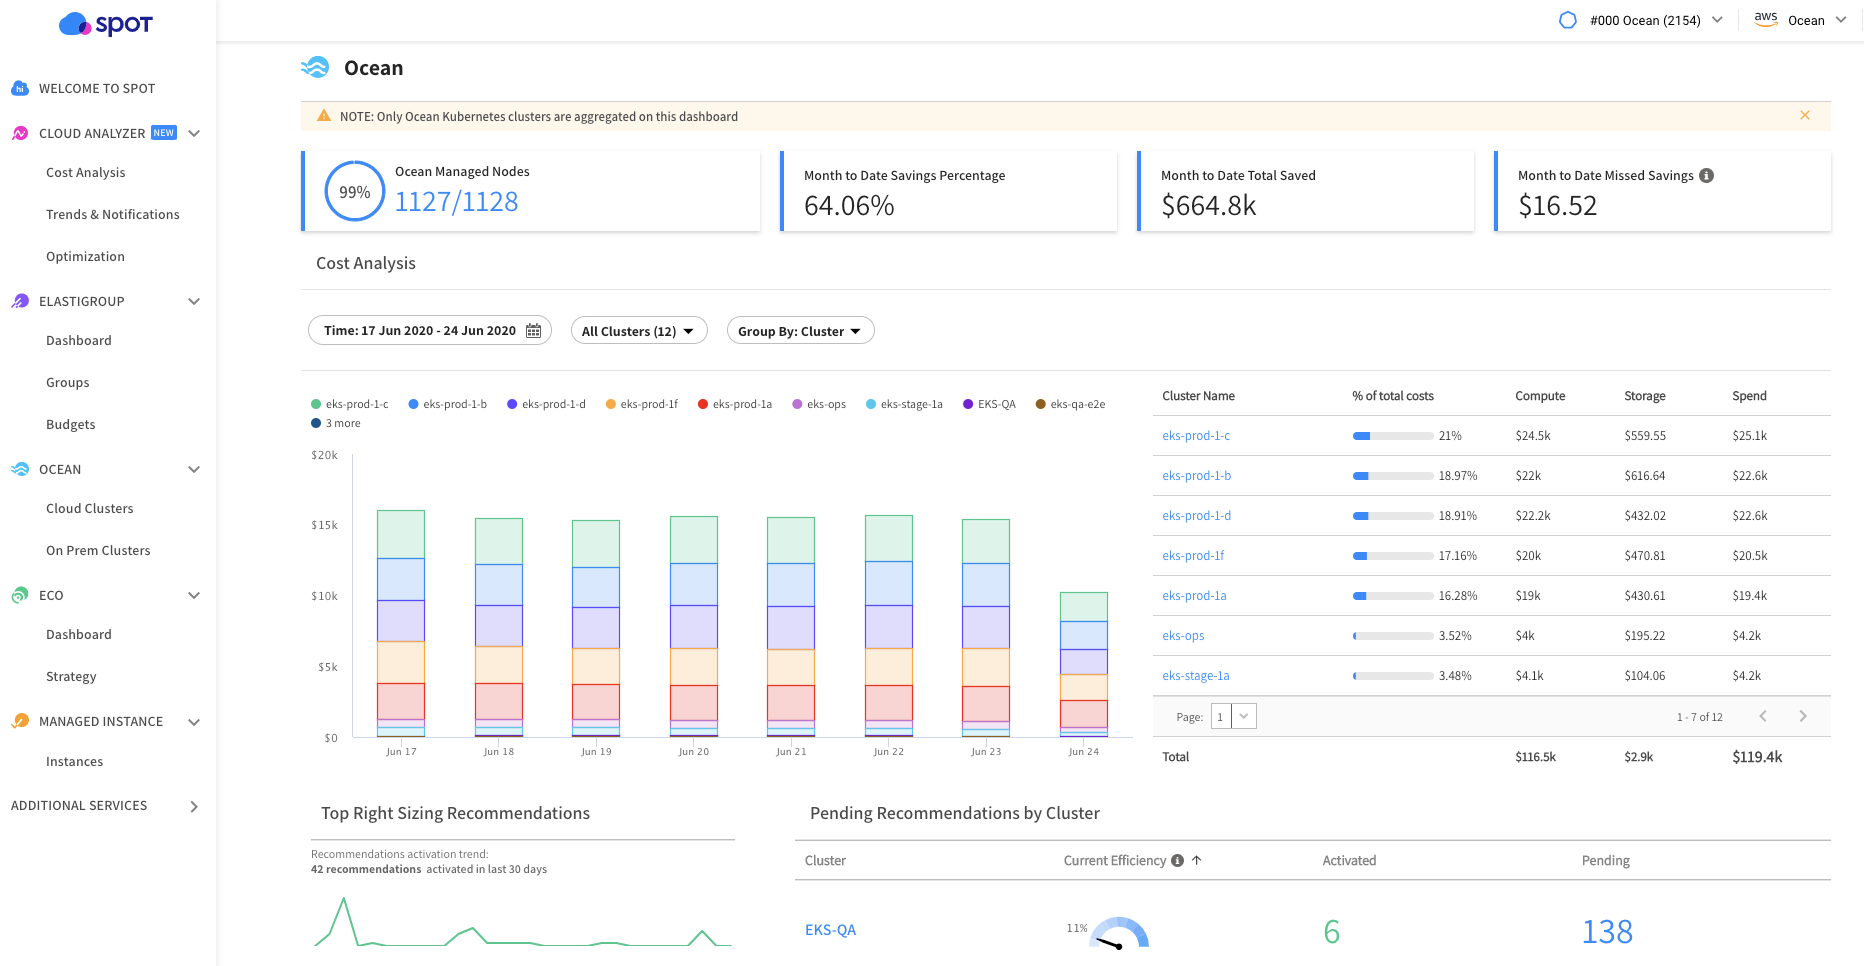
The Ocean dashboard gives you a high-level, 360º view of what each of your clusters are spending with easy access to cost analysis and right sizing recommendations within and across all clusters within your cloud account, so you can keep your Kubernetes deployments as optimized as possible.
Let’s take a look at some of the key features in the new Ocean dashboard.
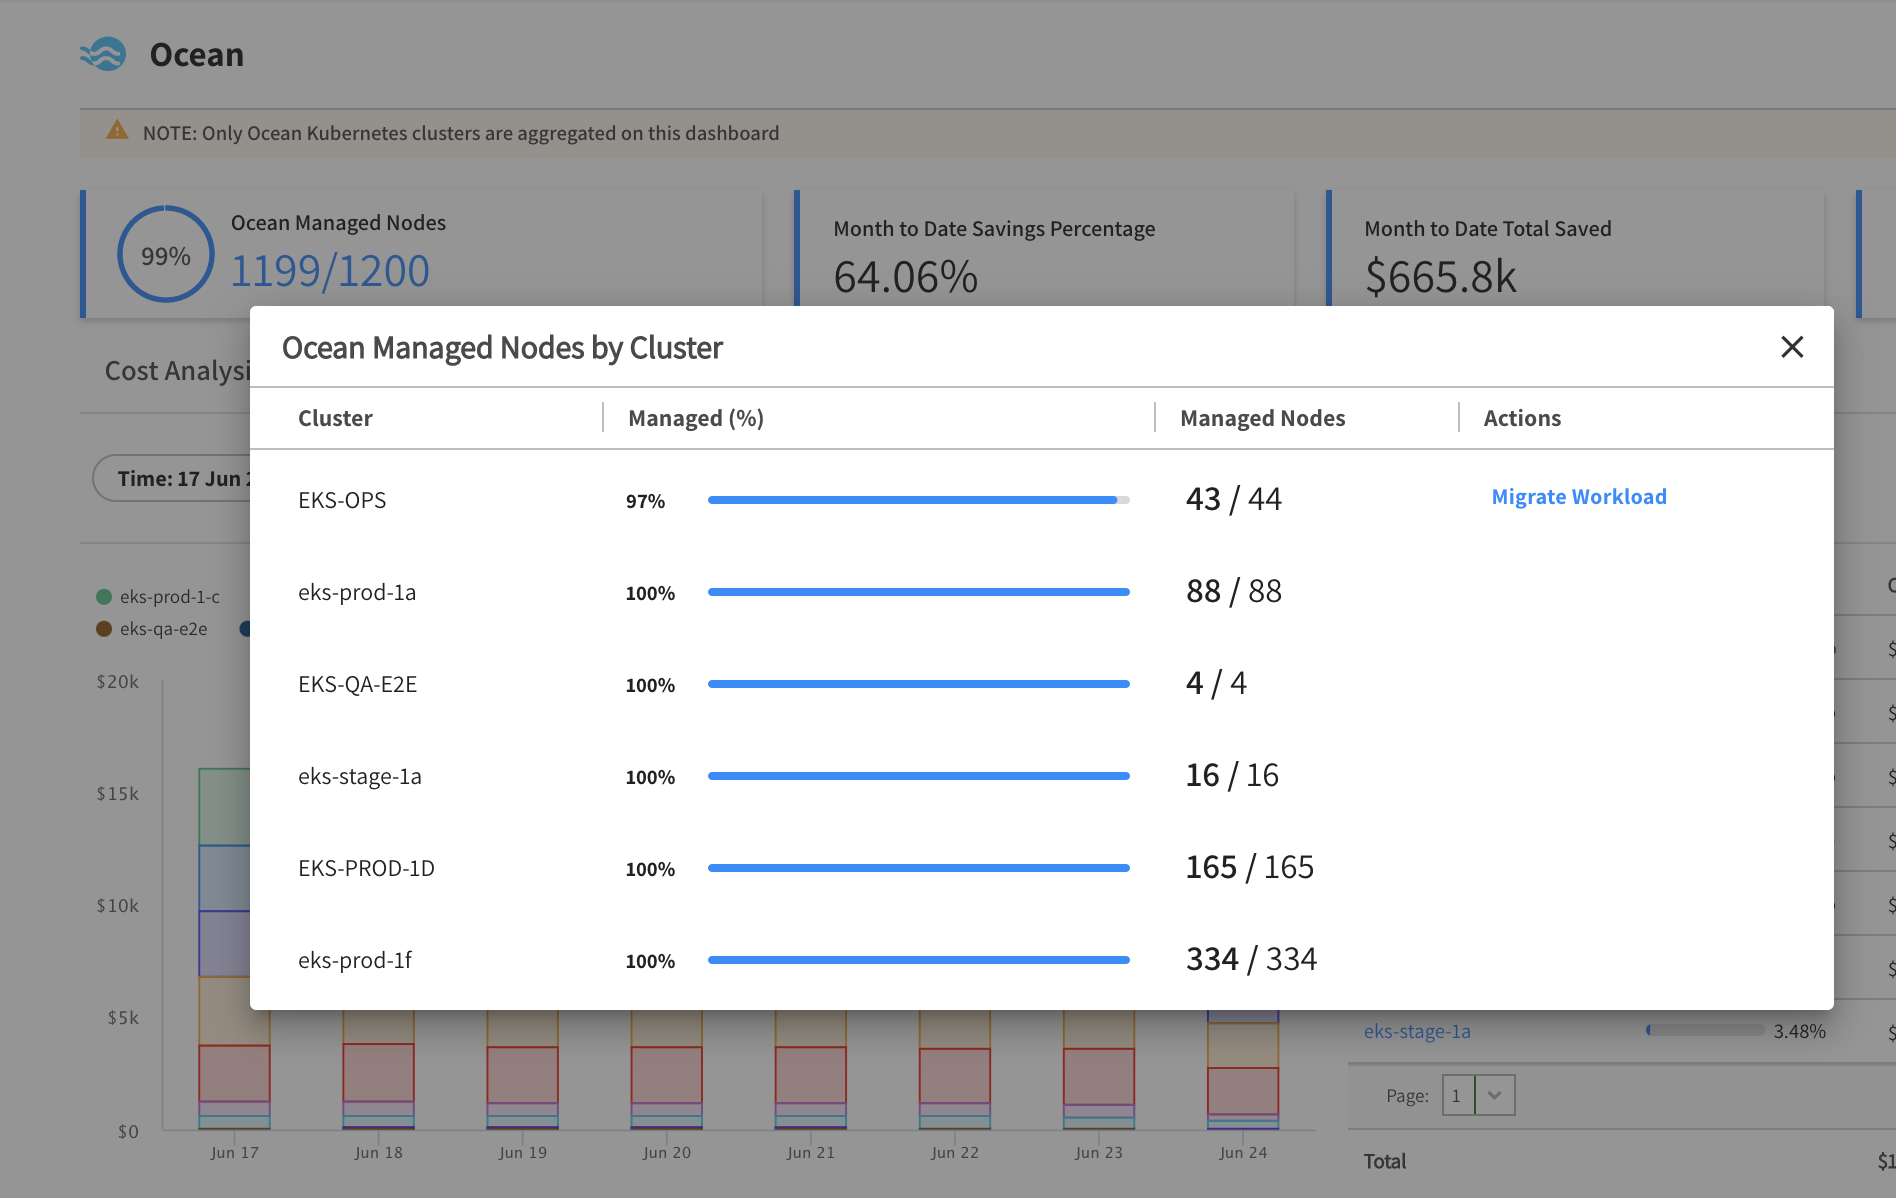
Ocean managed nodes
This indicates how many nodes in all clusters within your cloud account (that are connected to Ocean) are actually being managed by Ocean.
Migrating your Kubernetes nodes into Ocean not only reduces your compute costs by up to 90%, but also eliminates much of the day-to-day management of the underlying infrastructure such as ensuring your workloads always have sufficient resources to run on, right-sizing cluster requirements and automatically bin packing them for maximum efficiency.
Those nodes that are not yet managed by Ocean can be seamlessly migrated with a single click.
Cost analysis within and across all clusters
In the bar chart on the left, you can slice and dice your clusters’ costs based on additional criteria such as namespace, resource, annotation and labels. One of the unique aspects of this view is that you can group costs based on these aforementioned criteria, not just within a single cluster, but across all existing clusters within your cloud account.
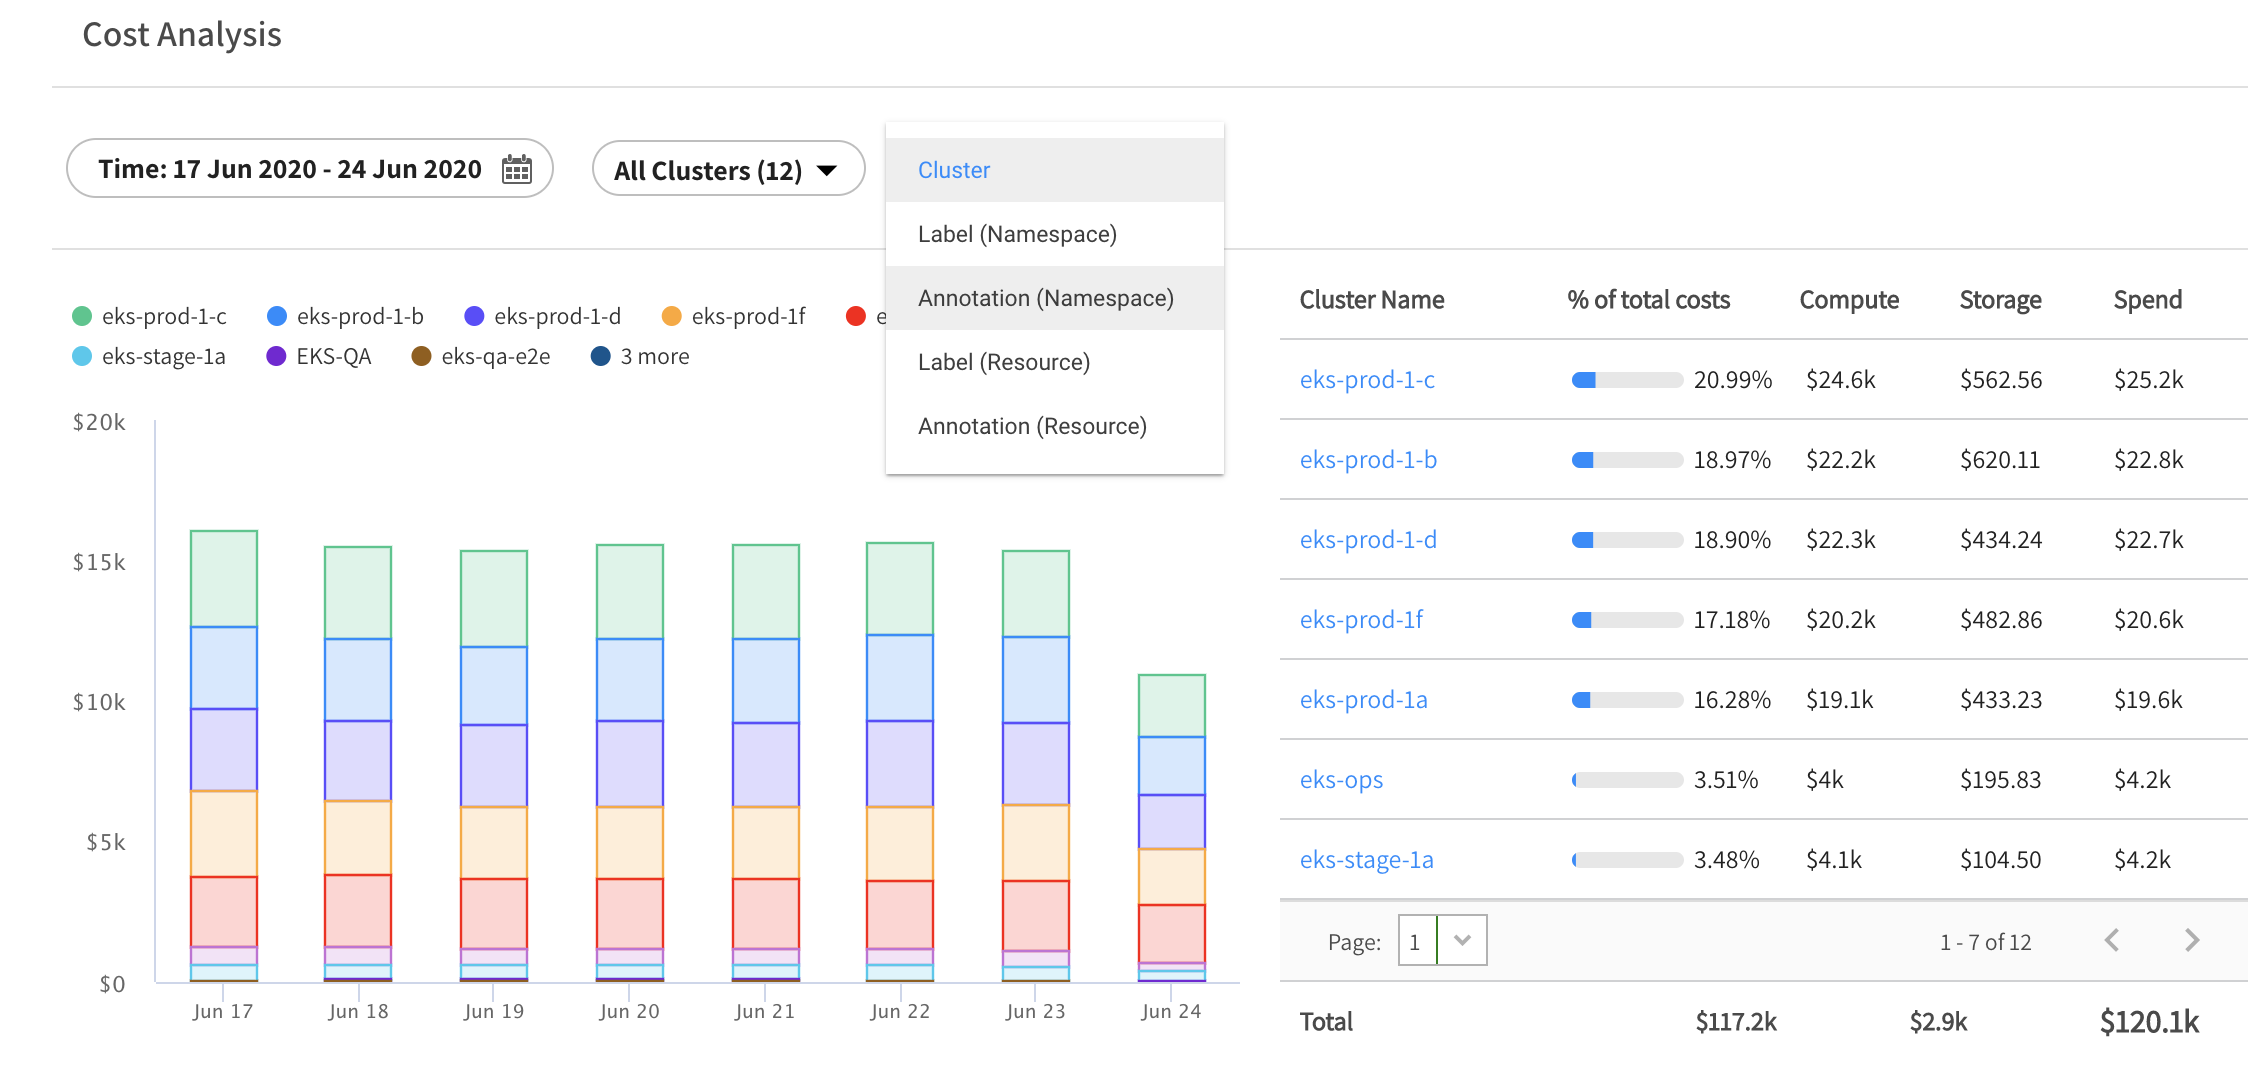
The table on the right shows all clusters with their contribution to the total cost, broken down by compute and storage. You can drill-down into each and every cluster for full usage and cost analysis.
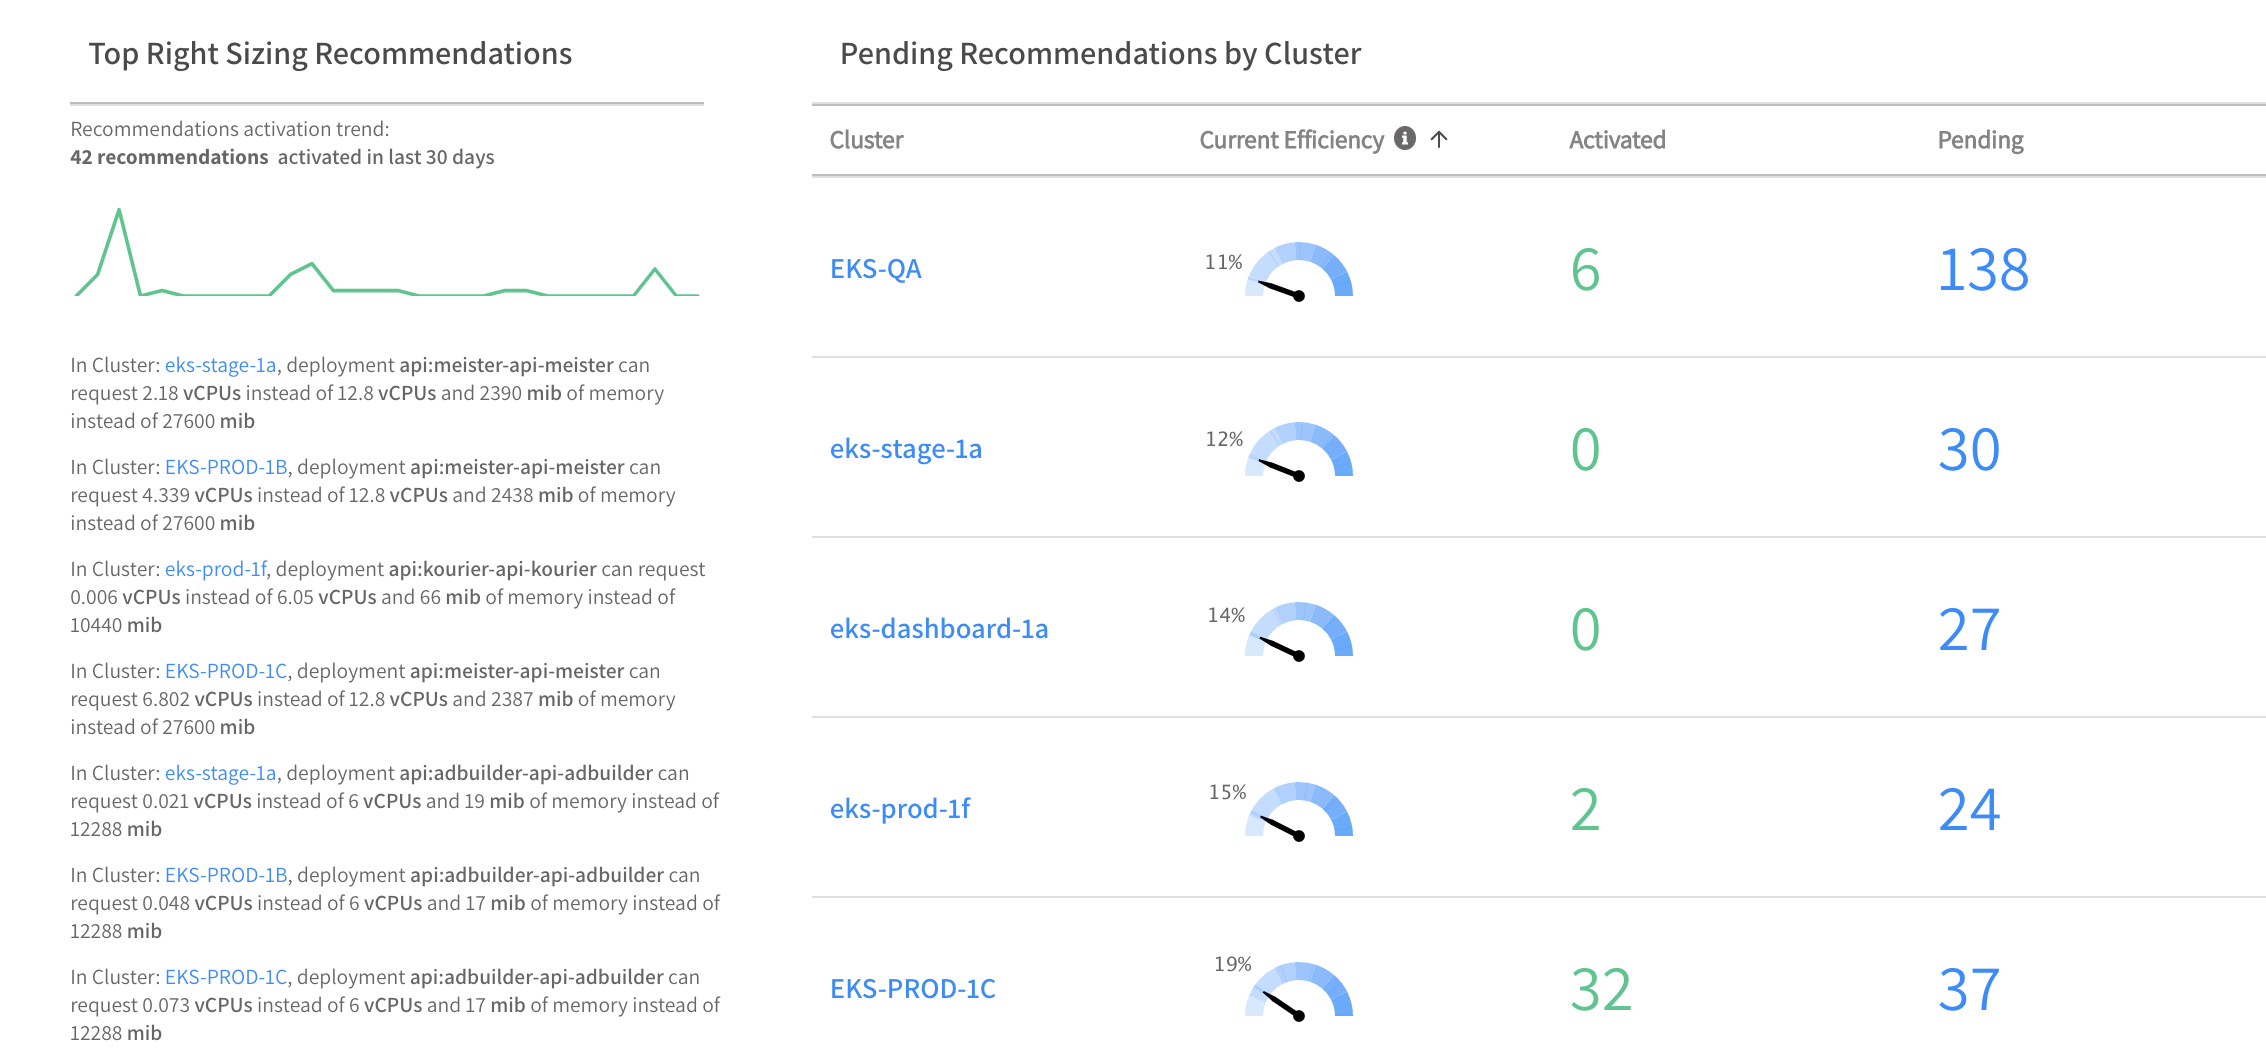
Right-sizing recommendations
Even with the best planning, it’s common for over-provisioning to occur when defining container requirements. This can significantly and unnecessarily increase cloud costs. To remedy this, Ocean analyzes each cluster’s utilization of requested resources and offers recommendations for right-sizing (both up and down). In the screenshot below, the table shows how efficiently each cluster utilizes the available resources. It also shows how many insights (sizing recommendations) have been activated (implemented) as well as how many are still pending. The latter list can be seen in detail by clicking on the numbers in the Pending column for each cluster.
On the far left side, the top right-sizing recommendations can be seen for all clusters, allowing you to focus on those that can have the greatest potential cost impact for your entire environment. You can also see the trend of how many recommendations have been activated in the last 30 days.
Check it out today and as always, we’d love to hear your feedback!