 Microsoft Azure
 Cloud Financial Management (FinOps)
 How to Operationalize FinOps

Ocean Cost Analysis: No surprises from unexpected cloud costs
Is the lack of cost visibility in your Kubernetes cluster driving you crazy? Do you spend hours trying to decipher your cloud provider bill in order to break down the cost per team or per service (chargeback)?

Kubernetes certainly simplifies deployment, management, and scaling of applications but for cost visibility, look no further, Ocean Cost Analysis is your answer. It provides Kubernetes application level visibility to your cloud provider costs. It breaks down the cloud infrastructure costs of your Kubernetes cluster so that you know which application or team is responsible for how much of the costs (chargeback). Ocean supports compute (CPU and memory) as well as storage (Persistent Volume, Root Volume and File) cost analysis.
The Problem: Find the Grinch who stole the network?
What about network costs? How do I debug a spike in data transfer costs on my cloud provider bill? Is there a Grinch who stole the network?
What could have caused the unexpected network cost spike?
There are many possibilities, what could it be?
- Faulty application(s) or a misconfiguration – perhaps a web application that is using a database service in the wrong location or Region.
- Misunderstood pricing – Incoming traffic or Intra-AZ traffic is assumed to be free, which may not always be true. Cloud provider pricing can be confusing, if traffic is using services like DNS, NAT Gateway, Load balancer with Public IPs then traffic in both directions, incoming and outgoing, may have a cost.
- Sub-optimal deployment – Applications are using services in different availability zones (AZ). Deploy applications in a way so as to prefer service endpoints in the same availability zone. This can be accomplished in multiple ways. Consider enabling Kubernetes topology aware hints or deploy using pod topology spread constraints or pod affinity/anti-affinity or setup ingress or load balancers to prefer local AZ.
But wait, before we can try to root cause the issue and find a possible fix, we need to first find “The Grinch” application that “stole the network.”
Network cost visibility: Show me the money?
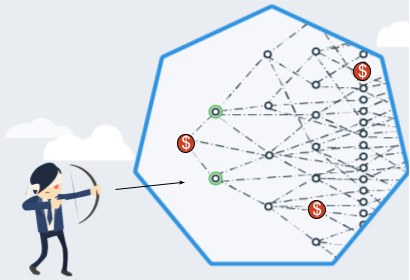
If you have large multi-tenant clusters with more than 20 nodes, hundreds of application services (workloads) with thousands of transient microservices (pods or containers), how do you find the application or service responsible for the unexpected high network costs? Without any network cost visibility, it’s like being blindfolded and shooting at unknown targets.
Keep your Kubernetes network costs in check with Ocean Network Cost Analysis (available for AWS EKS)
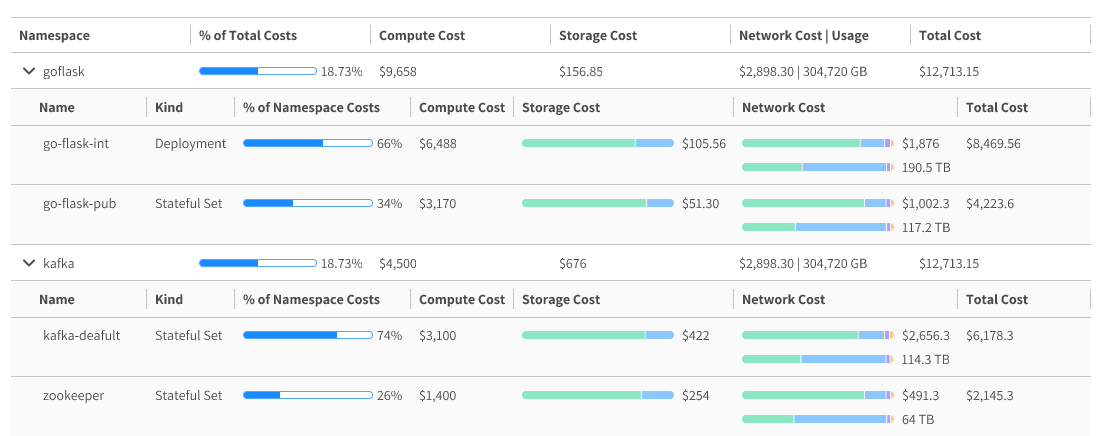
Ocean introduces Network Cost Analysis, which not only provides Kubernetes application level visibility of network cost (in $) and bandwidth usage (in GB) but also shows you spend and usage trends so you can better predict future costs. Track your workload network costs on daily, weekly and monthly schedules and forecast future monthly metrics usage and spend.
What? Do I need another tool for network costs?
Can’t I use existing application performance monitoring (APM) tools and cloud provider cost tools?
- APM tools focus on performance monitoring and finding network bottlenecks, not on cloud cost efficiency. Applications with high bandwidth usage may not always have high network costs. It depends on who they are talking to and where they are deployed in the cloud.
- Cloud provider cost tools focus on the data transfer cost for the cloud provider service (VM instance, load balancer, NAT gateway) but don’t break down the cost to your Kubernetes application service. So you don’t know if your EC2 Internet costs are due to your web application or database service?
How is Ocean Network Cost Analysis different?
Ocean Cost Analysis is uniquely positioned to merge the complex worlds of cloud provider pricing and transient Kubernetes services. With the Ocean autoscaler (controller) already embedded in your Kubernetes cluster and the necessary cloud provider access, Ocean is already actively managing and tracking your Kubernetes applications and cloud provider services. Ocean Network Cost Analysis requires installing a lightweight network client to be enabled on every node to track traffic flows in and out of pods. eBPF (TC BPF) is the defacto Linux technology for efficient network monitoring with minimum impact to the node, using very little resources. The Ocean eBPF network client adds hooks to the node and pod interfaces, to capture IP packet headers, track source and destination IP addresses and packet byte counts.
Ocean Network Cost Analysis can answer all your questions on cloud provider network cost breakdown, including:
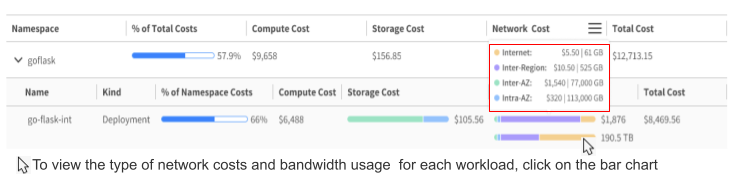
- Which applications or services in my Kubernetes cluster have the most internet or inter-region or inter-AZ data transfer costs?
- How much of my application traffic (in GB) stays within the local AZ and incurs no cost?
- How much of my application intra-AZ traffic has a cost due using public IPs or crossing VPN or cluster boundaries?
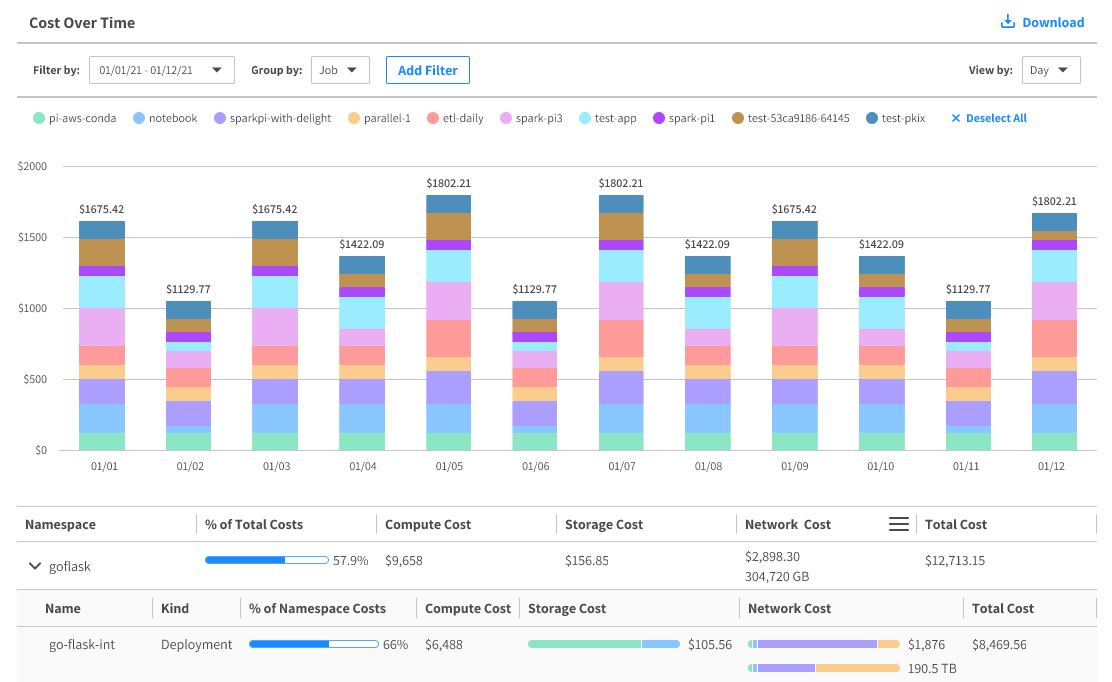
The network traffic usage and cost metrics are aggregated over time; allowing you to zoom in or out to a specific day, week or month or track weekly or monthly spend trends to forecast future costs. You can download and export cost and usage data (CSV) from the console UI or use the Open API: Get Cluster Aggregated Detailed Costs to get customized cost reports (JSON) at the frequency you need.
You can slice and dice and carve out your network costs using grouping and filtering with standard Kubernetes resource identifiers (Namespaces, Labels, Annotations) using automation via the API or with the UI console. You can have immediate responses to all your DevOps and FinOps chargeback questions:
- Which teams or departments (Namespaces) have the most network costs?
- How much data transfer costs do my database applications (Resource Label:App) have across all my clusters?
- What are my production vs. non-production environments (Resource Annotation:Env) network costs?
- Where can I see all my resource (compute, storage, network) cost trends over the last few weeks or months, so that I can better forecast my tenant or account costs?
Next: Give Ocean Network Costs a try and request a free trial now!
Ocean Cost Analysis not only provides cost visibility to all levels of DevOps, FinOps and Engineering in your organization but also empowers your developers and engineers to bring cost efficiency into their decision making when deploying applications in your Kubernetes cluster(s).
Ocean Network Cost Analysis is available for AWS EKS clusters. Install the Ocean network client and contact Sales or Support to start your 60-day free trial.